Global Temperature and Human Activity
Harvard University
The Issue:
There is compelling evidence that the earth has gotten warmer. Analysis by scientists at NASA’s Goddard Institute for Space Studies (GISS) indicates an increase of average temperatures of 0.8 degree Celsius (1.4 degrees Fahrenheit) since 1880, with two-thirds of this warming occurring since 1975. Moreover, the ten warmest years since 1880 have occurred since 2005. Climate scientists agree that this warming is extremely likely to be the result of human activity. That conclusion is based on models of the climate system, which are complex and hard for non-specialists to understand. Are there simpler statistical methods that provide a similar conclusion and thus provide independent validation of the model-based conclusions?
Can standard econometric tools be used to estimate how much of this warming is anthropogenic, that is, due to human activity?
The Facts:
- According to the National Aeronautics and Space Administration (NASA), 97 percent of climate scientists who are active in publishing research agree that it is extremely likely that human activity has contributed to climate warming. A wide number of scientific associations have published statements agreeing with this view, including the American Association for the Advancement of Science, the American Geophysical Union, and the United States National Academy of Sciences. The majority of these studies see human activity as an important driver behind climate change but the extent of this contribution is open to question. Yet, debate continues in the political sphere about the extent to which warming is anthropogenic – perhaps due, in part, to the complex nature of the climate models upon which this conclusion is based.
- Statistical analysis of historical data offers one way to determine the contribution of human activity to the warming of the planet. The earth is warmed by energy from the sun, which is in part radiated back towards space. Some of this radiated energy is absorbed, then reemitted by atmospheric gases back towards the earth, causing additional warming. This is the greenhouse effect. Important greenhouse gases emitted by human activity are Carbon Dioxide (CO2), Methane (CH4), Nitrous Oxide (N2O), and chloro- and hydro-fluorocarbons.
- Greenhouse gases and temperatures have persistent trends, and unless one is careful, an analysis of those trends can lead to estimates that only reflect spurious relationships. Statistical tools developed by economists – in particular cointegration methods, for which Sir Clive Granger won the Nobel Prize in 2003 – have been designed to handle such trends and to avoid spurious relationships. Although the substance and topics are quite different, in a purely statistical sense, climate data and economic data have many similarities so econometric tools for analyzing economic data can be fruitfully applied to climate data.
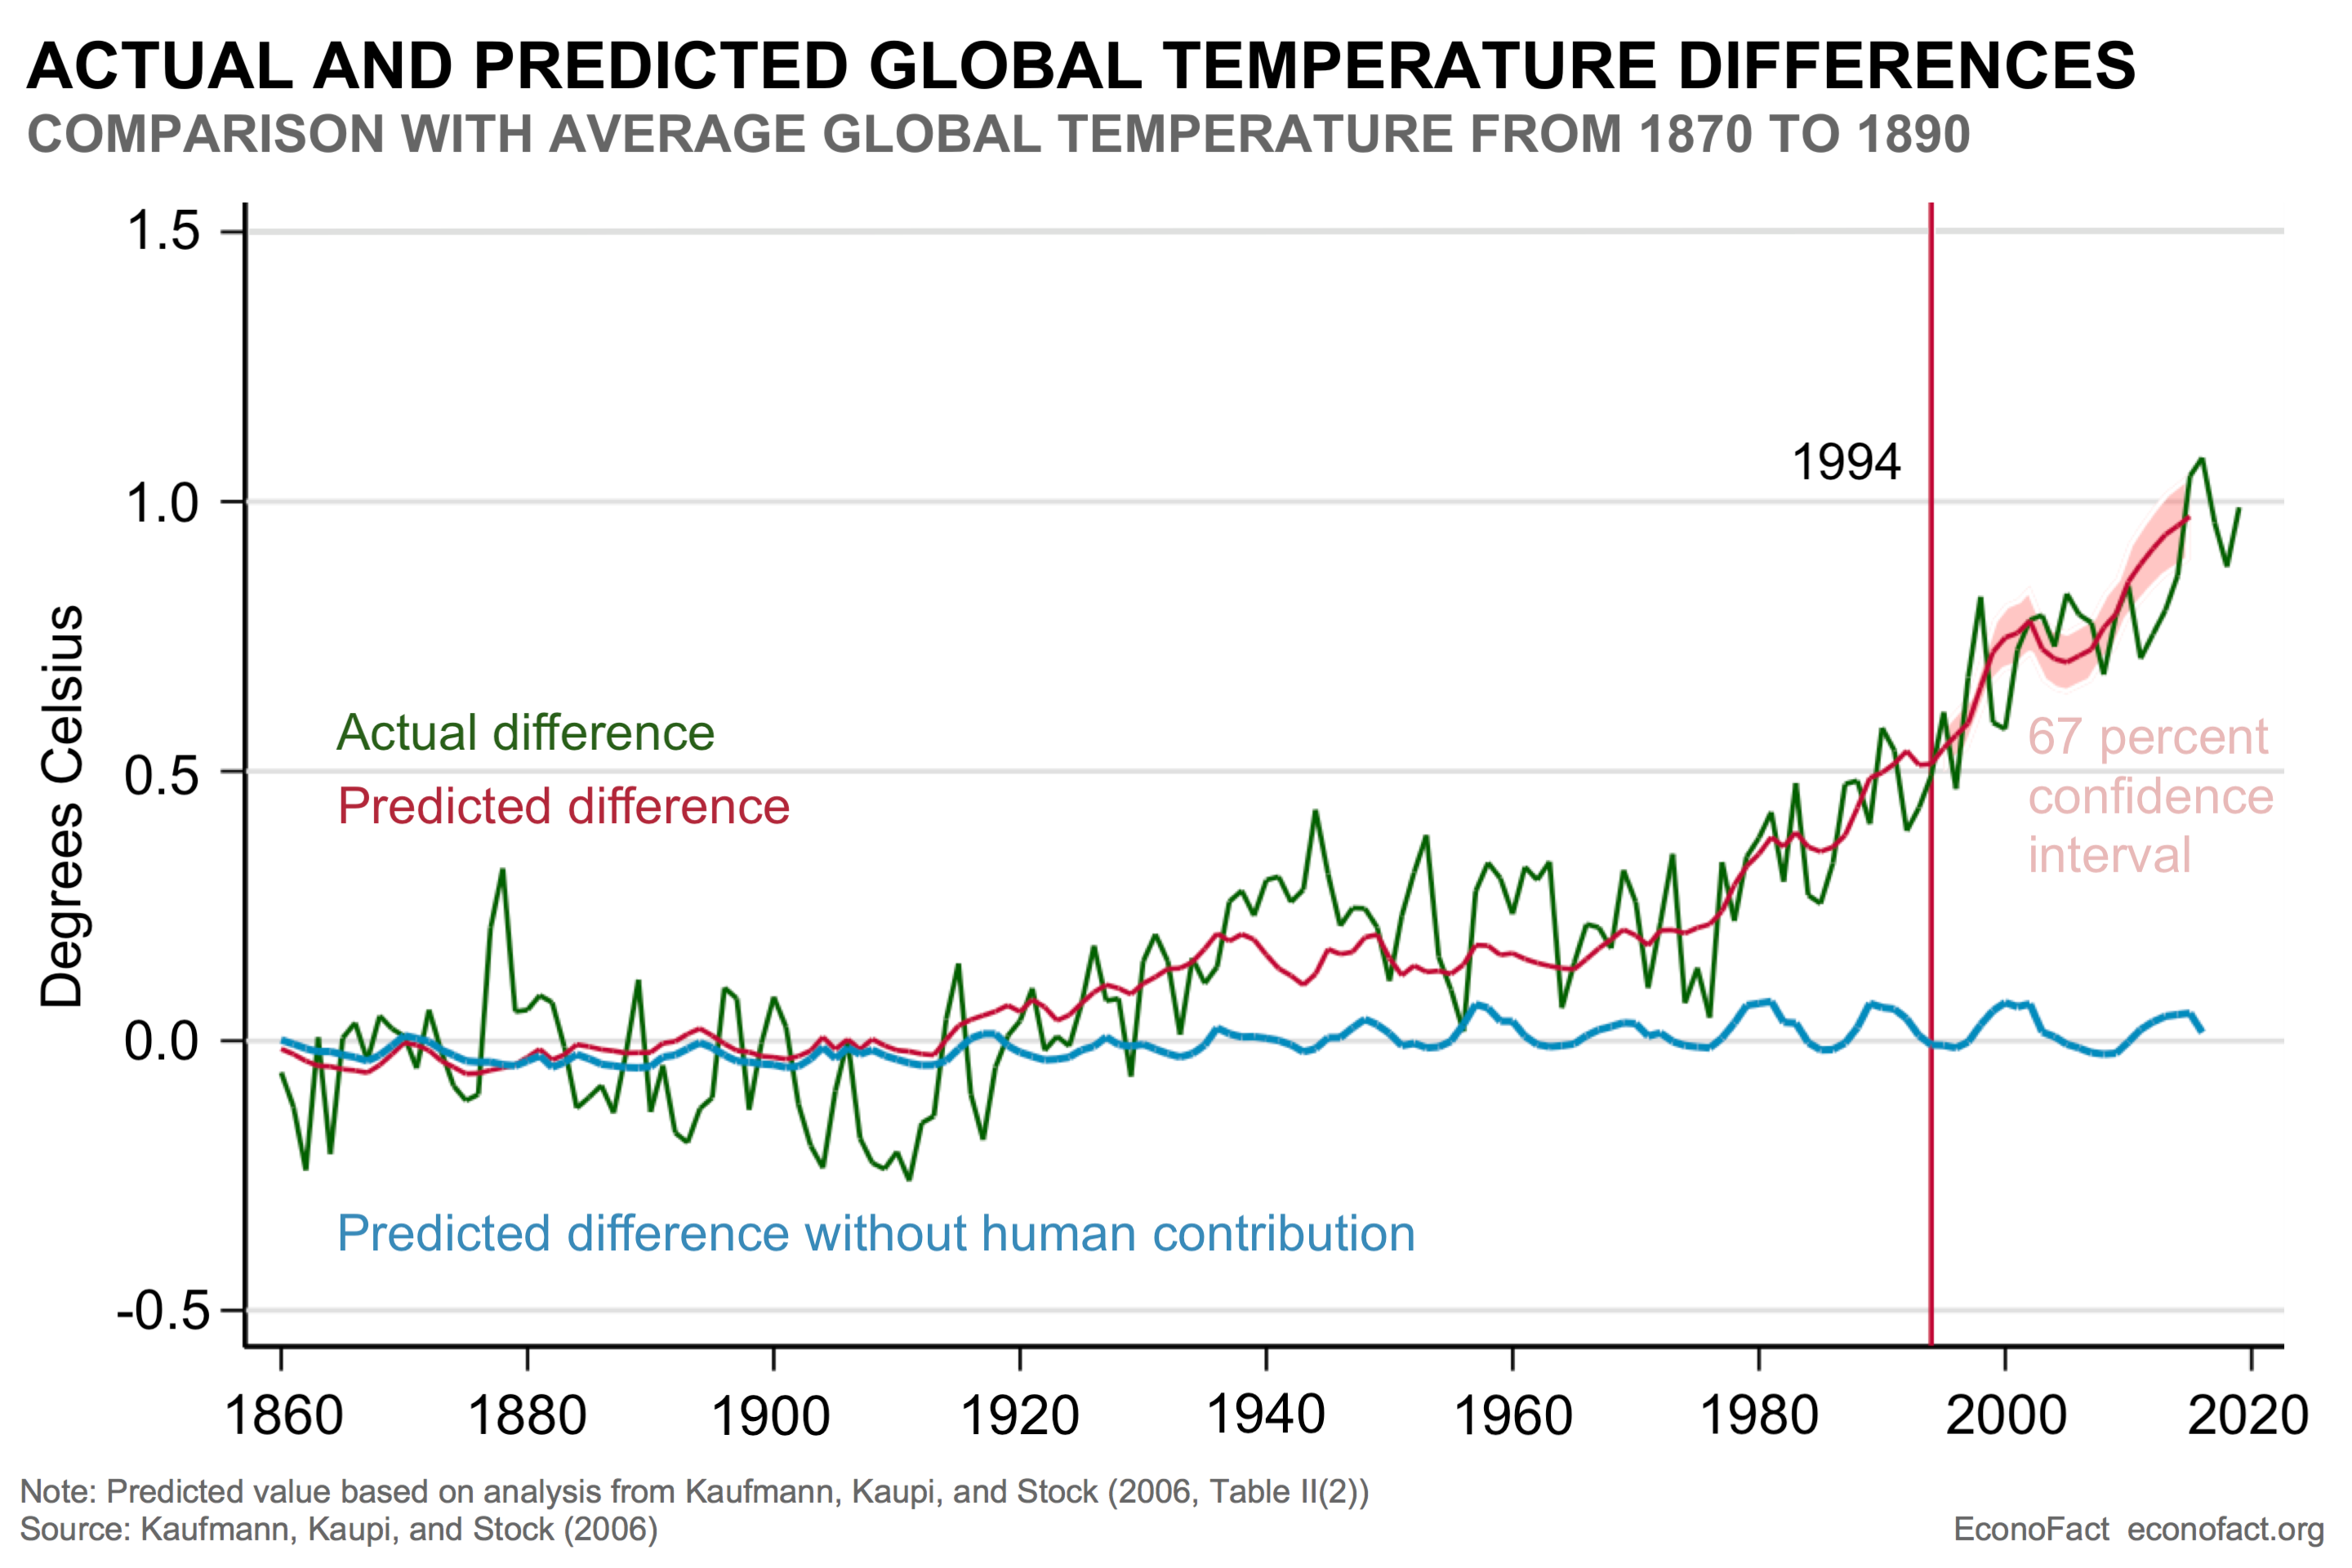
- Two co-authors and I conducted an analysis published in 2006 that used cointegration methods to estimate the relationship between total energy impacting the earth (called radiative forcing) and global mean temperature. Radiative forcing is the sum of solar radiative forcing and radiative forcing from greenhouse gases. The figure plots temperature and its predicted value, using the relationship we estimated using data from 1860-1994 (all the data we had at the time, because of data availability lags). Because our data ended in 1994 (denoted by the vertical line in the figure), the past 20 years of data provide a true out-of-sample test of our regression relationship between radiative forcing and temperature. The red dashed line post-1994 is the predicted temperature, using our published regression estimate and post-1994 data on radiative forcing but not using temperature data for that period (the shaded region shows 67 percent confidence interval for the prediction). The figure illustrates that the published regression does a very good job predicting the path of temperature post 1994. For fifteen years starting in 1998, there was a warming “hiatus”, which has been used to argue against warming being linked to ever-increasing concentrations of carbon dioxide. In our model, the hiatus is due to increased emissions of sulfur oxides (which reflects sunlight back into space) from new coal plants in China, and a long lull in the solar cycle. Since then, temperatures have been rising, just as the regression predicts.
- The regression provides a simple way to estimate how much of the observed warming since 1870 is natural and how much is anthropogenic. To do so, consider the counterfactual in which anthropogenic emissions of greenhouse gases are held at their 1870-1890 average. The predicted value of temperature under this counterfactual is shown by the blue line in the figure; this is the temperature that would have obtained, absent greenhouse gas emissions due to human activity. The human contribution is the difference between the total predicted value (red dashed line) and the blue line that shows the predicted temperature absent greenhouse gas emissions due to human activity. Although natural sources are the major driver of predicted fluctuations in temperature before 1920, subsequently human emissions started to play a major role. Today, nearly all the increase in observed temperature is a result of anthropogenic emissions of greenhouse gases.
- The results from our statistical analysis match results from very different modes of analysis based on climate models that include radiative forcing. These alternative approaches use complicated computer models that simulate the interactions between the surface temperature of the earth, the temperature of the oceans, and the amount of greenhouse gasses emitted and accumulated in the atmosphere. Importantly, those models provide far more nuanced projections, such as regional effects, storms, droughts, and so forth, than does our simple regression approach. Because the regression approach does not use climate models, it provides an independent check on those models. For example, our model suggests that a doubling of the pre-industrial era concentration of carbon dioxide in the atmosphere would raise the surface temperature by 2.1 degrees Celsius. This estimate is within the range of 0.8 to 2.5 degrees Celsius predicted by climate models as the response to a doubling of CO2 concentrations over a 70-year period.
What this Means:
The earth is warming, with consequences including storms, heat waves, and droughts that we already see. Climate models attribute those changes to greenhouse gases emitted by human activities, but the complexity of those models provides an opportunity for muddying the waters in the political debate over climate. In fact, however, the core relationship between temperature and greenhouse gas emissions can be analyzed using standard statistical methods used in economics, with no need for a complex climate model. That relationship stands up over time and clearly attributes nearly all the observed warming to human impacts. That this result, which stays close to the data, aligns with results from climate models provides external validation of those models and the warnings they provide about future climate change as we continue to emit greenhouse gases.