
Fiscal and Economic Effects of Tariffs
American Enterprise Institute
Executive Summary
Tariffs have become an important economic policy in the United States. Tariffs are a form of excise tax that applies to imported goods. They can be imposed for three, sometimes contradictory, reasons: to generate revenue, protect domestic industries, and retaliate against other countries for economic or non-economic reasons. As with other taxes, tariffs have important equity and efficiency considerations. Although they can raise revenue and protect certain domestic industries, they reduce economic output, misallocate resources in the economy, reduce the quantity and quality of goods and services available to consumers, and burden households with lower real after-tax incomes. In the current environment, tariff policy has been a source of uncertainty for businesses and households both because of the Administration announcing tariffs and then changing the rates or delaying their imposition, as well as because of legal challenges that have struck down tariffs
I. Tariff Basics
Tariffs are a tax on imported goods. Tariffs are collected when the tariffed goods enter the United States. Tariffs can be levied either as a fixed percent of the value of an import, a fixed dollar value per imported good, or as a tariff-rate quota, which applies tax when the value of certain imports exceeds a certain threshold (Pomerleau and York 2025).
Like all taxes, tariffs affect the price and quantity of goods on which they are levied. An excise tax increases the price paid by consumers and decreases the price received by sellers of the product. An important issue with any tax is its incidence – by how much do consumer prices rise and by how much does the price received by producers fall? In the case of tariffs, the consumers are domestic residents while the producers are foreign, which has implications for whether the costs of tariffs are borne by American consumers or foreign sellers. The extent to which a tariff is paid by domestic residents is called its pass-through – for example if a 10% tariff results in an increase in the price of domestic goods by 6% then the pass-through is 60%. Research suggests that tariffs are primarily passed through to U.S. importers as higher import prices (Amiti et al 2019) and the extent of price pass-through rises over time. Evidence on the latest round of tariffs suggests that the pass-through is almost 100%, that is, United States consumers are bearing the full costs of tariffs (Gopinath and Neiman 2026). Between March 2025 and May 2026, The price of imported goods rose by 6.8 percent relative to a pre-tariff price trend between March 2025 and May 2026, as measured by a study that tracks the online prices of over 350,000 products sold at five large U.S. retailers. The largest price increases observed were in carpets and other floor coverings (54 percent), other articles of clothing and clothing accessories (24 percent) coffee, tea, and cocoa (16 percent), and fish and seafood (16 percent) (Cavallo, Llamas, and Vazquez, 2025b).
Tariffs that raise the price of imported goods can also result in rising prices of domestically produced goods that compete with those imports. When the price of an imported good rises due to a tariff (or for other reasons), domestic producers who sell goods that compete with those imports raise the price of their goods as well since they have less competitive price pressure from foreign goods (Cavallo, Llamas, and Vazquez, 2025a). Experience from President Trump’s first term suggests that even untaxed complimentary goods can face price increases due to tariffs. For example, the price of clothes dryers rose after tariffs were applied to imported washing machines in 2019. Importantly, the increase in the price of domestically-produced goods generates no tariff revenue for the government.
The burden of tariffs is shared broadly. Research shows that while tariffs burden households of all income levels, they tend to be regressive taxes – that is, they fall proportionally more heavily on lower-income households, who devote a larger share of their income to consumption of goods that are either subject to tariffs or that compete with tariffed imports (Tax Policy Center 2024). As an example, the Tax Policy Center estimated that if the tariffs in place as of December 2025 stayed in place during 2026, they would reduce household after-tax income by 2 percent for the bottom 95 percent of households. At the same time, this tax would reduce after-tax income for the top 1 percent and top 0.1 percent by 1.7 and 1.5 percent, respectively.
Distributional Impact of a 10% Tariff on All Imports and a 60% Tariff on Imports from China
| Expanded Cash Income Percentile | Percent Change in After-tax Income |
| 0%-20% | -2.0% |
| 20%-40% | -2.0% |
| 40%-60% | -2.0% |
| 60%-80% | -2.0% |
| 80%-90% | -2.0% |
| 90%-95% | -2.0% |
| 95%-99% | -1.9% |
| Top 1% | -1.7% |
| Top 0.1% | -1.5% |
Source: Tax Policy Center 2025
II. Tariffs and Government Finances
19th Century history does not offer a good parallel for thinking about the importance of tariffs as a source of revenue. Tariffs represented about 90 percent of federal revenue at the time of the founding of the United States when the federal government did not levy any income or payroll taxes (see chart below). Regardless of their share of revenue, tariff collections only averaged as much as 1.7 percent of GDP between 1790 and 1900 (Carter et al. 2006). But at that time, and throughout the 19th century, total federal revenues and spending were only roughly 2 percent of GDP (U.S. Census 1949; Johnston and Williamson 2025) as opposed to about 20 percent of GDP today. Tariff revenue fell to roughly 50 percent after the Civil War as the purpose of tariffs shifted to be primarily about protecting domestic industries. Tariff revenues eventually fell to under 1 percent of total revenues after World War II due to the combination of trade liberalization and the fact that other taxes, such as the income tax, became more important sources of revenue.
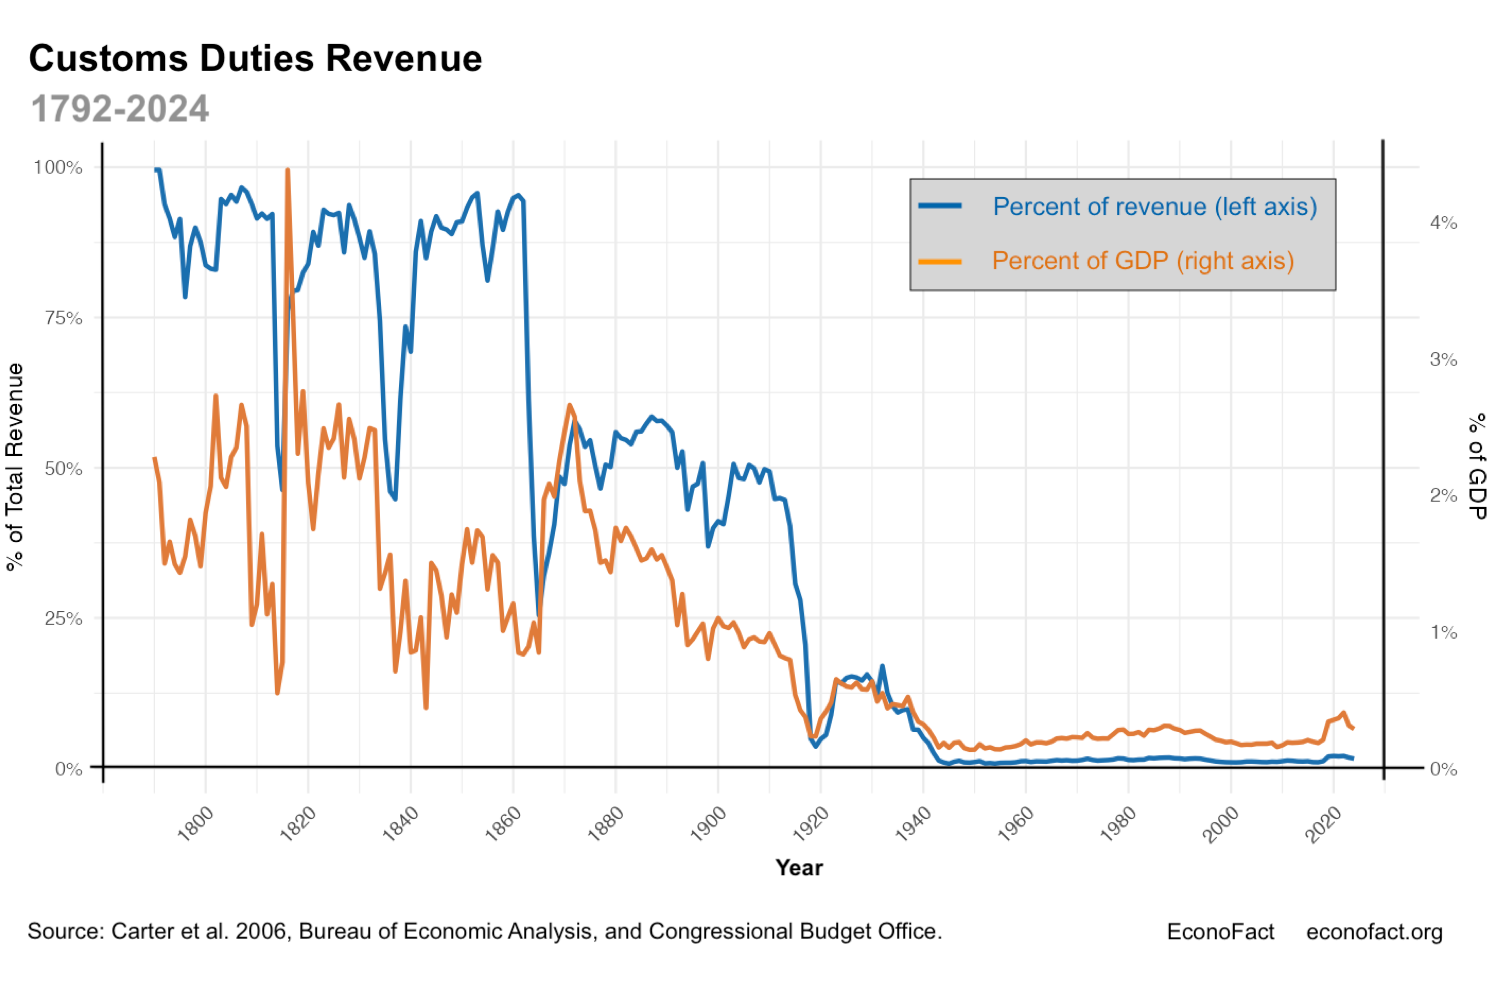
Click here for a larger version of the graph
Tariff revenues remain, and will continue to be, a small proportion of overall government revenues. The recent increase in tariff rates significantly increased tariff revenue. In 2025, the federal government raised $264 billion from customs duties, which is roughly $185 billion more than in 2024 (U.S. Department of the Treasury 2025). It was estimated that if tariffs had been left in place at the levels imposed in 2025, they would have raised federal revenue by between $2.1 trillion and $2.8 trillion over the next ten years relative to what the federal government brought in previously. (Swagel 2025; Penn Wharton Budget Model 2025; York and Durante 2025; Tax Policy Center 2025; Yale Budget Lab 2025a). Even in this scenario, tariff revenue remained a relatively small share (at most, 4 percent) of the $67.5 trillion in revenues the federal government is projected to raise over the next decade (Congressional Budget Office 2025). However, the Supreme Court ruled against the tariffs imposed by the Trump administration under the International Emergency Economic Powers Act (IEEPA) in February 2026, reducing projected tariff revenues. The Congressional Budget Office estimated that the reduction in tariff revenues following the Supreme Court’s decision would result in federal deficits being $2.0 trillion larger over the 2026–2036 period. (These estimates did not take into account any refunds that the government could make on previously collected tariffs).
Tariff revenues could be offset by other factors. The extent to which tariffs will ultimately improve federal finances is somewhat uncertain. President Trump frequently announces, pauses, and cancels tariffs. This raises uncertainty about the course of trade policy, which makes it difficult to predict how businesses and individuals will respond to such significant levies on trade. Research on behavioral responses shows that there can be significant changes in consumer and producer behavior in response to tariffs (Boehm et al. 2023), although the applicability of those results to a situation where tariffs frequently change or are levied at such high rates is unclear.
III. Tariffs and the Trade Balance
Supporters of tariffs are concerned about the trade deficit and want to reduce it — but are generally mistaken about the implications of using tariffs to address the trade deficit. The United States has, for decades, had a trade deficit: the country imports more than it exports. Reducing or eliminating the trade deficit has been a goal of the Trump administration. But there are several issues with using tariffs to address the trade deficit. First, if tariffs did, in fact, reduce imports then tariffs would not be a reliable source of revenue. Second, there are reasons to think that tariffs would have only limited, at best, consequences for the United States trade account. Furthermore, there is a basic misconception about the determinants of the overall trade balance and its implications for the economic performance of the economy.
The United States has persistently had a trade deficit over the last 50 years. The United States has run both trade surpluses and deficits over its history but has run a persistent trade deficit since 1975. In 2024, the United States ran a trade deficit of roughly $900 billion, which is roughly about 3.1 percent of GDP (U.S. Bureau of Economic Analysis 2025a). But it is worth noting that both exports and imports are much higher today than they were in 1975. Exports as a share of output have risen from 8 percent to 11 percent while imports have risen from 8.1 percent to 14 percent. The trade account includes both transactions in goods and in services like tourism, entertainment, and consulting. And while the United States runs a trade deficit in goods, it runs a surplus in services. In 2024, the U.S. exported $310.9 billion more services than it imported, for a services surplus equal to 1.1 percent of GDP. At the same time, the U.S. imported $1.2 trillion more goods than it exported (4.1 percent of GDP) (U.S. Bureau of Economic Analysis 2025a).
Source: Bureau of Economic Analysis
The overall trade account reflects national consumption, saving, and investment, not microeconomic factors like the relative price of goods and services from different countries. A country’s trade surplus or deficit is equivalent to the relationship between its national savings and national investment (see box below). When a country saves more than it invests (such as in factories and equipment) (or, equivalently, earns more than it spends), it will have a trade surplus. That excess savings (or excess income) is lent to the rest of the world and represents a capital outflow. Conversely, when a country invests more than it saves (or, equivalently, spends more than it earns), the country will be borrowing from the rest of the world, which results in a capital inflow. These relationships are necessarily true – they are accounting identities.
National Income Accounting and The Trade Account
The relationship between saving, investment, and the trade balance is true each year and can be demonstrated with national accounting identities. In every year, total output or income (Y) in the United States is equal to the sum of consumption (C), investment (I), government consumption and gross investment (G) and net exports (NX):
Equation 1: Y = C + I + G+ NX.
Rearranging this identity, we see that net exports (NX) is equal to total income (Y) minus total spending on consumption and investment (C, G, and I):
Equation 2: NX = Y – C – I – G.
This can be rearranged and simplified by relabeling total income minus total consumption (Y – C) as private saving (S): S = Y – C. Furthermore, public saving is equal to taxes (T) minus government consumption expenditures and investment (G). Put together, net exports (NX) is equal to private saving (S) minus investment (I) minus public saving (T-G):
Equation 3: NX = (S – I) – (T – G).
Tariffs don’t influence the overall balance of trade. Although tariffs are promoted to reduce “trade imbalances,” they do not have a direct impact on the overall balance of trade since they do not directly affect national savings nor national investment. If saving and investment remain unchanged, tariffs could reduce the total amount of trade, but not the balance. Rather, the United States’s overall balance of trade is influenced by policies that impact the attractiveness of saving and investment in the United States. Policies that make domestic investment more attractive such as reductions in source-based business taxes on investment, deregulation, infrastructure, a skilled workforce, and the rule of law, can attract investment from overseas and, all else equal, tend to boost the trade deficit. Likewise, policies that make saving more attractive, all else equal, tend to reduce the trade deficit by increasing national saving relative to investment (Pomerleau and York 2025). The trade deficit can also be influenced by the federal budget. As discussed above, part of national saving is the saving or dissaving of federal, state, and local governments. The federal government runs a budget deficit of roughly 3 percent of GDP. Much of that deficit is financed by foreigners who lend to the United States and allow us to spend more than we earn as a nation. Increases in the budget deficit that are not matched with increases in private saving can increase the trade deficit by reducing national saving relative to investment. In contrast, reduction in the budget deficit can increase national saving relative to investment and can shrink the budget deficit. This relationship is often referred to as the “twin deficit” phenomenon.
Tariffs can affect bilateral trade balances. Bilateral trade balances, the difference between imports and exports between the United States and a single trading partner, reflect comparative advantage, the structure of supply chains, and the location of natural resources. Countries such as Vietnam and Madagascar, with which we run persistent trade deficits, excel at producing products the United States wants but are not rich enough to purchase many of the goods and services produced by the U.S. At the same time, the United States runs a significant trade surplus with the Netherlands because many U.S. exports for the rest of Europe arrive in Rotterdam and are therefore counted as Dutch imports. Tariffs can influence bilateral trade balances by making it more expensive to import from certain countries. This can reduce some bilateral trade deficits and increase others. One common way tariffs distort trade patterns is through “transshipping” or the diversion of goods to third countries to avoid tariffs. After the enactment of Chinese tariffs in 2019, firms began exporting Chinese goods to Vietnam and relabeling them as Vietnamese goods to avoid taxation (Iyoha et al. 2024).
Recorded bilateral trade balances can differ from the actual value of goods bought and sold between countries because of international supply chains and the trade in intermediate goods. For example, if South Korea, Japan, and other countries all sell inputs to an iPhone to China, and the iPhone assembled in China is sold to the United States, the full value of the iPhone is counted as an import from China but the value added by China, in assembling the iPhone, may be a small fraction of the recorded import price from China. (Klein and Melitz 2017). Thus, countries further down the international supply chain will tend to have larger recorded export values because they export higher value-added products even if they only contributed a small share of total value added.
A trade deficit is itself not a sign of weak economic performance. Supporters of tariffs also argue that a trade deficit is a drag on economic growth. For example, Peter Navarro has referred to the “trade deficit drag” (Klein and Chinn 2017). This observation confuses an accounting identity with a formula that explains GDP. A growing trade deficit is not necessarily associated with a weaker economy. The United States may run a trade deficit in years in which the U.S. economy is strong, attracting foreign investment to the United States. Likewise, a trade deficit may fall if foreign investors view the U.S. economy as weak. In fact, the trade deficit tends to grow in years in which the U.S. economy is performing well (Klein and Chinn; 2017). For example, the trade deficit more than doubled as a share of the economy between 1982 and 1984 as real GDP grew by 12.1 percent. In contrast, the last large reduction in the trade deficit occurred during the Great Recession — the trade deficit shrank from 5 percent of GDP in 2008 to 2.9 percent of GDP in 2009 (U.S. Bureau of Economic Analysis 2025b).
IV. Tariffs and the Broader Economy
Tariffs may protect domestic industries at a steep cost. Another standard argument in favor of tariffs is that they provide protection to domestic industries from foreign competition. It argues, for instance, that tariffs can make domestic manufacturing more profitable and lead to the re-shoring of manufacturing in the United States. In this view, the cost to consumers is worth the benefit of protecting certain industries such as steel or semiconductors. This tradeoff is likely far steeper than originally thought due to the complexity of supply chains. Notably, tariffs may end up harming far more downstream industries than they help. The most notable example of this phenomenon is the steel industry and the steel tariffs during the first Trump administration. There are 80 jobs in industries that use steel for every one job in steel-producing firms. As a result, research has generally found that the steel tariffs ended up producing little-to-no jobs gains in steel producing industries (Russ and Cox 2020).
Tariffs can reduce economic output. Tariffs lead to lower economic output (GDP) in the long run by distorting economic incentives. An important way in which tariffs distort incentives is by raising the cost of production. Firms that use imported capital goods face lower returns on investment in the presence of tariffs (Swagel 2024). Tariffs can also lead to lower real after-tax wages for workers (York and Durante 2025). Several organizations have estimated that tariffs reduce both short-run and long-run economic output. According to modeling by the Yale Budget Lab, Trump’s tariff policy would reduce the level of long-run economic output by 0.4 percent (Yale Budget Lab 2025). Similarly, the Tax Foundation estimates that current tariff policy will make the level of economic output 0.6 lower (York and Durante 2025). This reduction in economic activity represents a reduction in household earnings, worker productivity and, ultimately, living standards.
Tariffs and economic uncertainty. In addition to their direct effects on the cost of production, tariffs can reduce economic output by increasing uncertainty (Swagel 2024). Tariffs that are imposed and then lowered or removed, increase economic uncertainty. The majority of the “Liberation Day” tariff rates on countries across the world that were announced in April 2025, have since been increased, decreased, canceled or delayed. For example, the imposition of the broad-based “reciprocal” tariffs on each and every U.S. trading partner, were delayed after negative stock market reaction to this policy (York and Durante 2025). Legal challenges to tariffs have also contributed to an uncertain situation. President Trump’s attempt to use expansive authority under the International Emergency Economic Powers Act (IEEPA) to enact broad-based tariffs on all imports was struck down by the Supreme Court in February 2026 in Learning Resources, Inc. v. Trump and Trump v. VOS Selections, Inc.. The Court ruled that IEEPA does not give the President the authority to impose tariffs. The President then imposed an additional 10% global tariff under Section 122 of the Trade Act of 1974. This act allows presidents to impose temporary import surcharges to address “large and serious United States balance-of-payments deficits.” But in May 2026, the U.S. Court of International Trade struck down these tariffs as exceeding the President’s authority although it limited its relief to the three importer plaintiffs, leaving all other importers still subject to the 10% surcharge.The uncertainty associated with these tariffs can negatively impact economic activity, as businesses put off hiring and investment since these decisions have long- run implications that become more risky with the possibility of changing future tariff policy.
Tariffs hurt consumers beyond their effects on raising prices. International trade provides a greater variety of goods, not just cheaper goods. For example, the United States does not grow coffee, rather it is imported from countries like Brazil, Ethiopia, and Costa Rica. Tariffs on coffee not only raise their price but could also end sales from certain countries. This is also true of a wide range of other goods like bananas, chocolate, certain types of teas and medicines. Furthermore, cheaper imports allow consumers to purchase a wider variety of goods with the same amount of income.
Tariffs can also prompt foreign retaliation. The direct negative effect of U.S. tariffs on the economy understates the ultimate economic harm of protectionism (Pomerleau and York 2025). Foreign jurisdictions may retaliate against U.S. tariffs with levies of their own on U.S. exports, placing an additional burden on American producers. During the first Trump administration, retaliation by several jurisdictions, such as China and the EU applied tariffs to roughly 9 percent of U.S. exports (Williams and Hammond 2020). In addition to their broad economic effects, retaliation can work against any protection provided by U.S. tariffs. Research suggests that foreign retaliation during Trump’s first term, combined with U.S. tariffs on inputs, offset any supposed benefits of protection for the manufacturing industry (Flaaen and Pierce 2024).
V. Policy Implications
Tariffs should be viewed like any other tax: they can raise revenue but have important economic and distributional implications that lawmakers should consider. The discussion above suggests that tariffs are not an effective means of achieving their stated goals of raising significant revenues, revitalizing manufacturing, nor reducing the trade deficit. One distinction between current experience with tariffs and other taxes is the volatility in tariff policy, both because of changes by the Administration and because of legal challenges to these policies. This volatility raises uncertainty that adversely affects the economy.
Sources
Amiti, Mary, Stephen J. Redding, and David E. Weinstein. 2019. “The Impact of the 2018 Tariff on Prices and Welfare.” Journal of Economic Perspectives 33 (4): 187-210.
Boehm, Christoph E., Andrei A. Levchenko, and Nitya Pandalai-Nayar. 2023. “The Long and Short (Run) of Trade Elasticities.” American Economic Review 113 (4): 861–905. https://www.aeaweb.org/articles?id=10.1257/aer.20210225
Carter, Susan B., Scott Sigmund Gartner, Michael R. Haines, Alan L. Olmstead, Richard Sutch, and Gavin Wright, eds. 2006. Governance and International Relations. Vol 5. Of Historical Statistics of the United States. Millennial ed. Cambridge University Press.
Cavallo, Albtero, Paola Llamas, and Franco Vazquez. 2025a. “Are Tariffs Raising U.S. Retail Prices?” Econofact. https://econofact.org/are-tariffs-raising-u-s-retail-prices
Cavallo, Albtero, Paola Llamas, and Franco Vazquez. 2025b. “Harvard Pricing Lab Tariff Tracker” https://www.pricinglab.org/tariff-tracker/ (accessed May, 2026).
Congressional Budget Office. 2025. “The Budget and Economic Outlook: 2025 to 2035.” January 17. https://www.cbo.gov/publication/60870
Flaaen, Aaron, and Justin Pierce. 2024. “Disentangling the Effects of the 2018-2019 Tariffs on a Globally Connected U.S. Manufacturing Sector.” The Review of Economics and Statistics. September 16.
Gehrman, Elizabeth. 2019. “A ringing defense of Trump on trade.” April 26. https://news.harvard.edu/gazette/story/2019/04/at-harvard-peter-navarro-defends-trump-on-trade/
Gopinath, Gita and Brent Neiman. 2026. “The Incedence of Tariffs: Rates and Reality.” NBER Working Paper 34620. https://www.nber.org/papers/w34620
Irwin, Douglas A. 2017. Clashing over Commerce: A History of US Trade Policy. University of Chicago Press.
Iyoha, Ebehi, Edmund Malesky, Jaya Wen, and Sung-Ju Wu. 2024. “Exports in Disguise? Trade Rerouting during the US-China Trade War.” Harvard Business School Working Paper 24-072. https://www.hbs.edu/ris/Publication%20Files/24-072_d5780e10-7ebe-405a-840d-0d64c13aa2f2.pdf
Johnston, Louis and Samuel H. Williamson. 2025. “What Was the U.S. GDP Then?” Measuring Worth. https://www.measuringworth.com/datasets/usgdp/
Klein, Michael and Marc Melitz. 2017. “What Do We Learn From Bilateral Trade Deficits?” Econofact. https://econofact.org/what-do-we-learn-from-bilateral-trade-deficits
Klein, Michael and Menzie Chinn. 2017. “Is the Trade Deficit a Drag on Growth?” Econofact. https://econofact.org/is-the-trade-deficit-a-drag-on-growth
Lincicome, Scott and Alfredo Carrillo Obregon. 2026 “Tariffs “Funded” Everything in 2025—Will the Fantasy Continue in 2026? [UPDATE: Apparently, It Will]. Cato Institute. January 5. https://www.cato.org/blog/tariffs-funded-everything-2025-will-fantasy-continue-2026
Penn Wharton Budget Model. 2025. “Tariff Simulator: Revenue and Prices.” https://budgetmodel.wharton.upenn.edu/issues/2025/2/26/tariff-revenue-simulator
Pomerleau, Kyle and Erica York. 2025. “Understanding the Effects of Tariffs,” AEI Economic Perspectives. https://www.aei.org/wp-content/uploads/2025/08/Understanding-the-Effects-of-Tariffs.pdf?x85095
Russ, Kadee and Lydia Cox. 2020 “Steel Tariffs and U.S. Jobs Revisited.” Econofact. https://econofact.org/steel-tariffs-and-u-s-jobs-revisited
Swagel, Phill. 2024 “Effects of Illustrative Policies That Would Increase Tariffs.” Congressional Budget Office. https://www.cbo.gov/system/files/2024-12/61112-Tariffs.pdf
Swagel, Phill. 2025 “An Update About CBO’s Projections of the Budgetary Effects of Tariffs.” Congressional Budget Office. https://www.cbo.gov/publication/61697.
Tax Policy Center. 2025a. “T24-0050—Enact 60 Percent Tariff on Imports from China and 10 Percent Tariff on Imports from All Other Countries by ECI Percentile, 2025.” August 15. https://taxpolicycenter.org/model-estimates/biden-and-trump-tariffs-august2024/t24-0050-enact-60-percent-tariff-imports-china.
Tax Policy Center. 2025b. “Tracking the Trump Tariffs.” https://taxpolicycenter.org/features/tracking-trump-tariffs
U.S. Bureau of Economic Analysis. 2025a. “Table 1.1.5. Gross Domestic Product” (accessed Friday, October 31, 2025).
U.S. Bureau of Economic Analysis. 2025b. “Table 1.1.6. Real Gross Domestic Product, Chained Dollars” (accessed Tuesday December 16, 2025).
U.S. Census Bureau. 1949. “Historical Statistics of the United States, 1789-1945. Chapter P. Government.” https://www.census.gov/library/publications/1949/compendia/hist_stats_1789-1945.html
U.S. Department of the Treasury. 2025. “Final Monthly Treasury Statement, Receipts and Outlays of the United States Government for Fiscal Year 2026 Through December 31, 2025, and other Periods.” https://fiscaldata.treasury.gov/datasets/monthly-treasury-statement/summary-of-receipts-outlays-and-the-deficit-surplus-of-the-u-s-government
Williams, Brock, and Keigh E. Hammond. 2020. “Escalating U.S. Tariffs: Affected Trade.” Congressional Research Service. January 29.
Yale Budget Lab. 2025a. “State of U.S. Tariffs: October 17, 2025.” https://budgetlab.yale.edu/research/state-us-tariffs-october-17-2025
Yale Budget Lab. 2025b. “Estimated Budgetary, Distributional, and Macroeconomic Effects of “Tariff Dividends.” November 17. https://budgetlab.yale.edu/research/estimated-budgetary-distributional-and-macroeconomic-effects-tariff-dividends
York, Erica and Alex Durante. 2025. “Trump Tariffs: Tracking the Economic Impact of the Trump Trade War.” Tax Foundation. https://taxfoundation.org/research/all/federal/trump-tariffs-trade-war/