What Can the Employment Report Tell Us?
Harvard University and EconoFact
The Issue:
Slowing growth abroad, particularly in Germany and China, as well as ongoing trade disputes have spurred much recent discussion about the extent to which these factors might hurt the American economy. But how can we gauge how these factors and other developments are reverberating across the U.S. economy? Are we entering a recession? The Employment Situation report, released by the Bureau of Labor Statistics typically at 8:30am ET the first Friday of each month might be one of the first places where we see hard evidence of their effect.
The employment report provides a key source of information to those intent on figuring out what is going on in the economy in real time.
The Facts:
- The Employment Situation report provides information on the total number of people working, their hours and their earnings, as well as information on people who are not currently employed. The report gives an overall national picture, with additional detail about employment trends by industry and by worker characteristics such as age, gender, race and education. Rather than tallying every firm and reaching out to every working-age person, the report is based on two surveys that are designed to be representative of the nation as a whole. A household survey of about 60,000 households provides information on the labor force, employment, and unemployment of people 16 and older. An establishment survey collects data each month from the payroll records of a sample of about 142,000 businesses and government agencies to obtain detailed industry data on employment, hours, and earnings of workers on nonfarm payrolls (see here). The report itself typically contains a 3-page summary, 2 pages of key numbers and more than 30 pages of tables.
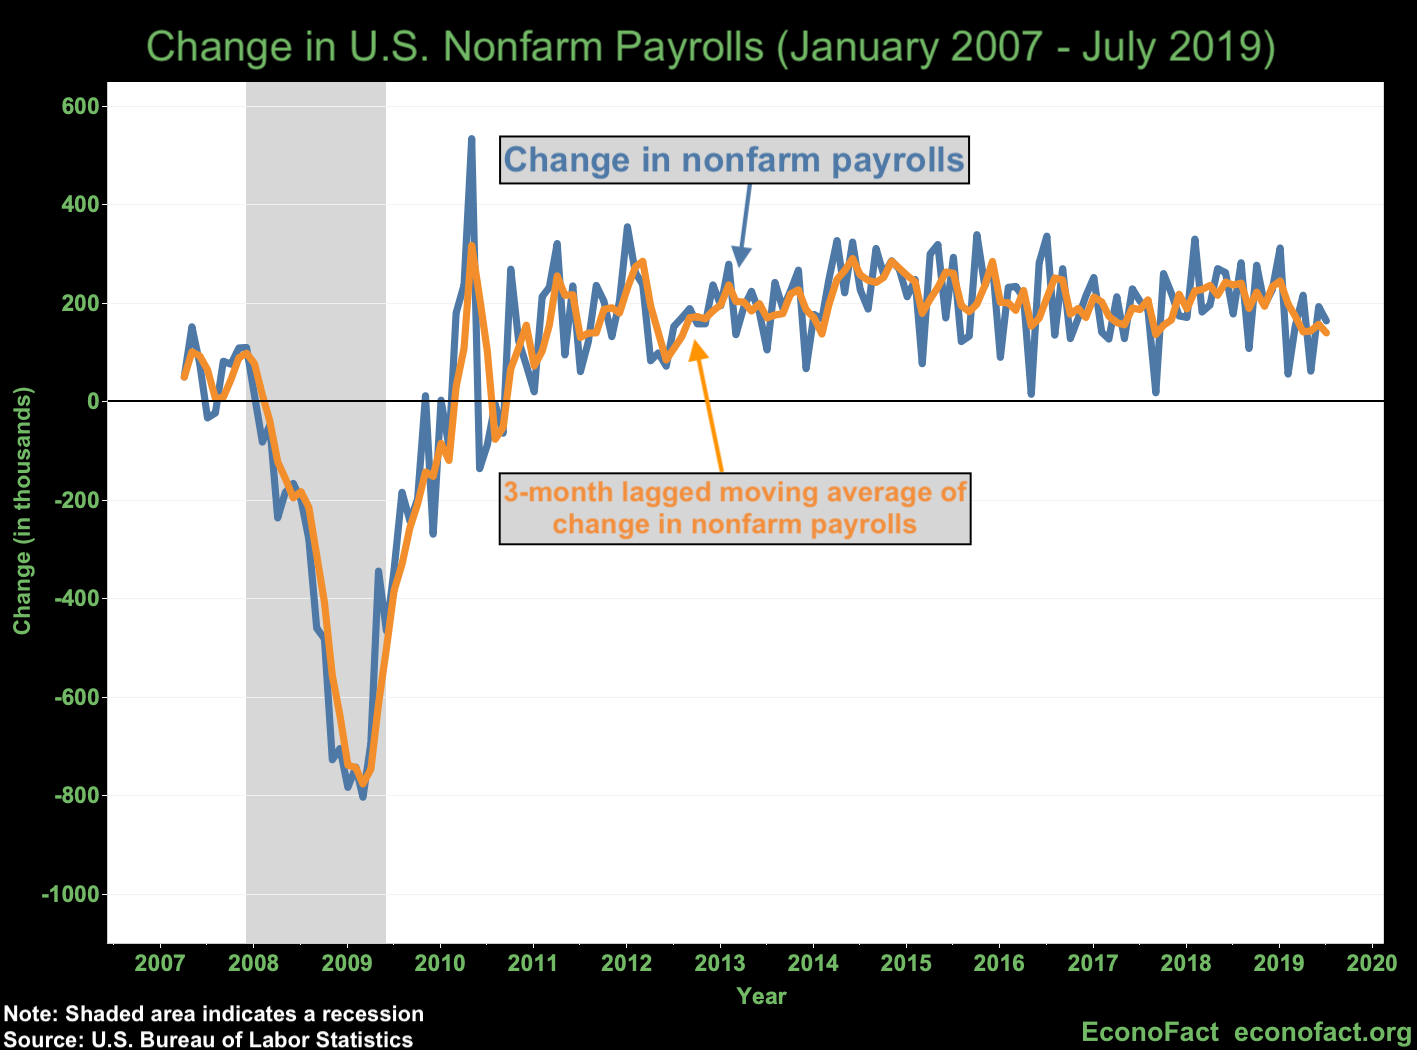
- The change in nonfarm payroll employment is generally the figure that gets the most attention as a fast summary of employment trends. But what do you make of the number? Is a 150,000-job growth figure a strong number for one month? Economists estimate that the rate of job growth that is consistent with the rate of growth of the labor force is between 50,000 and 110,000 per month. So, a job growth number that is 150,000 may be weaker than what is seen when the economy is rebounding from a slump or being boosted by fiscal stimulus, but it is strong relative to what would be the equilibrium job pace for the economy.
- Total nonfarm employment numbers can vary quite a bit from month to month. In interpreting the information from the release, one should not put too much weight on any one-month's observation. Looking at averages over time gives a better sense of the trend (see chart). Rather than focusing on one month's number, an average over several months provides a clearer picture on the underlying pace of growth.
- Moreover, early estimates of nonfarm payroll growth for a given month need to be taken with a grain of salt because they are subject to revision. The statistics released are the best numbers available at the time for nonfarm payroll employment. But, as more complete data filters in, a more accurate figure is obtained. And the revisions can be significant. Revisions often occur in the first two months after the initial release. For instance, the figure for nonfarm payroll growth in April 2019 was revised down from an initial estimate of 263,000 to a second estimate of 224,000 and then to a third estimate of 216,000. Other revisions occur as part of the annual “benchmark” adjustment. In August 2019, for example, the Bureau of Labor Statistics published an unusually large benchmark revision that indicated that the economy had added about 500,000 fewer jobs in the year through March than had been previously estimated.
- The unemployment rate has traditionally been viewed as the single best way to capture the tightness of the labor market, but, in the last few years, many economists have been looking at a broader suite of indicators to gauge how much “slack” is left in the labor market. The traditional view has been that that the unemployment rate falling below its “natural rate” is a sign that the economy may be overheating and vulnerable to a spike in inflation. The Congressional Budget Office and many other analysts currently put the “natural rate” of unemployment around 4.5 percent. The unemployment rate fell below this level in early 2017 and moved down further to an average of 3.8 percent in the first half of 2019. Yet, inflation has remained subdued. One explanation for these inflation dynamics pointed to by Federal Reserve Chairman Jerome Powell is that wage pressures have been partially relieved by a reserve of potential workers being drawn in from the sidelines of the labor force. Consistent with this view, the labor force participation rate of prime-age workers (those between 25-54) has been rising for the last few years (see here).
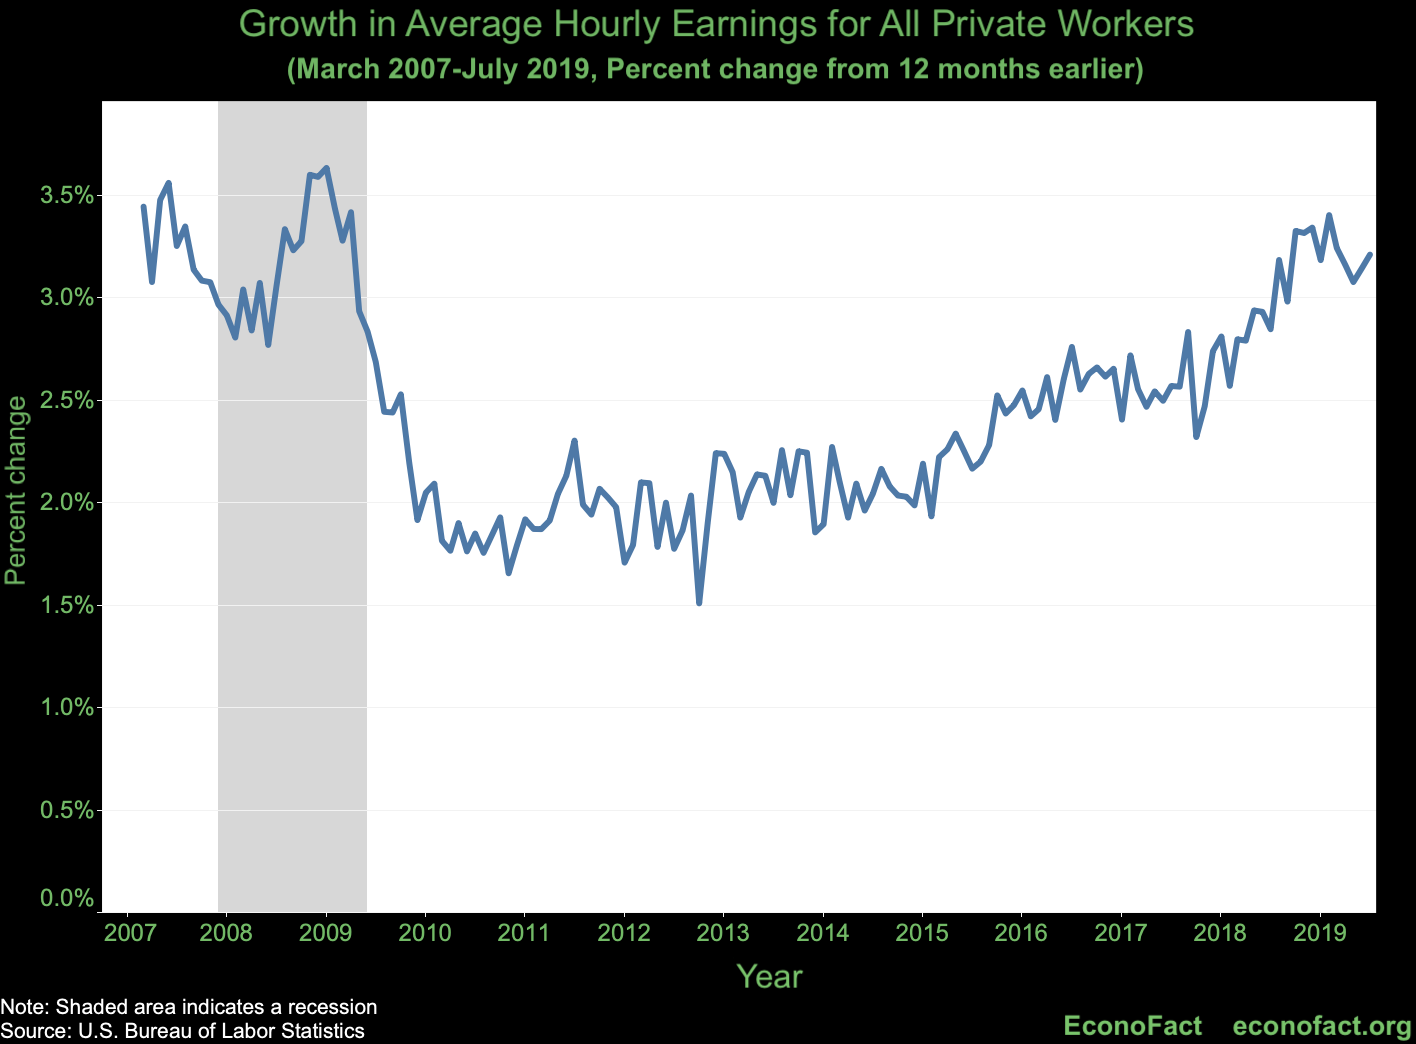
- Looking directly at wage growth can also provide information about whether the economy is overheating. It took wages a long time to start picking up in the wake of the Great Recession (see chart below). The higher wage growth associated with the “hot” labor markets of the mid-2010s has been a welcome development for workers. However, if wages were to accelerate markedly further on a sustained basis, it might be a sign that pick-up in inflation beyond desirable levels is on the way. (One caveat is that if the mix of workers is changing---as might the case in a recession in which lower-wage workers lose their jobs first---the profile of the “average” worker might change in a way that influences the patterns. To abstract from the influence of such compositional changes, analysts can look at the Employment Cost Index, an alternative measure of compensation that holds the mix of workers fixed.)
- The release of the employment report often has an immediate impact on financial markets. But the direction in which the market will move is not straightforward. Investors look at the report. They recognize that it offers news about the strength of the economy that has implications for future returns. But they also draw information from the report to anticipate whether the Fed is going to increase or decrease interest rates. How the market reacts to a positive or negative surprise can be difficult to interpret or predict. A weaker-than-expected labor market report could be followed by a drop in the stock market, for instance, as investors lower their expectations of future profits. Alternatively, the same information could be followed by a positive stock market jump if market analysts see it as a clear signal to the Fed that economic conditions require that the Fed change monetary policy so as to ease credit conditions in the near future.
What this Means:
Taking an accurate pulse of the economy in real time is difficult because information is incomplete and often arrives with a lag. Turning points, such as when a recession hits, are most often pinpointed in hindsight. Nonetheless, the employment report provides a key source of information to those who are intent on figuring out what is going on in the economy in real time. The sooner policymakers and investors are aware of changing conditions, the sooner they are able to take appropriate action.
Like what you’re reading? Subscribe to EconoFact Premium for exclusive additional content, and invitations to Q&A’s with leading economists.