Work and Poverty
Terner Center for Housing Innovation, University of California, Berkeley and University of California, Davis
(Click here for a larger version of the graph)
The Issue:
Safety net programs in the United States have promoted employment as a central component of anti-poverty policy, particularly since the welfare reform of the 1990s. Programs like the Earned Income Tax Credit (EITC), for instance, are designed to incentivize work by increasing workers’ after-tax incomes. While programs providing in-kind benefits, such as the Supplemental Nutrition Assistance Program (SNAP, formerly known as Food Stamps), require non-disabled, working-aged adults to work or look for work as a condition for receiving benefits. Proposals to increase or add work requirements to safety net programs have been a frequent feature of policy debates in Washington, as was evident most recently when Congress increased the work requirements for SNAP during debt limit negotiations in 2023. Necessary context for these requirements is the extent to which people in poverty are already working or unable to work, and the extent to which working is sufficient to lift people above poverty.
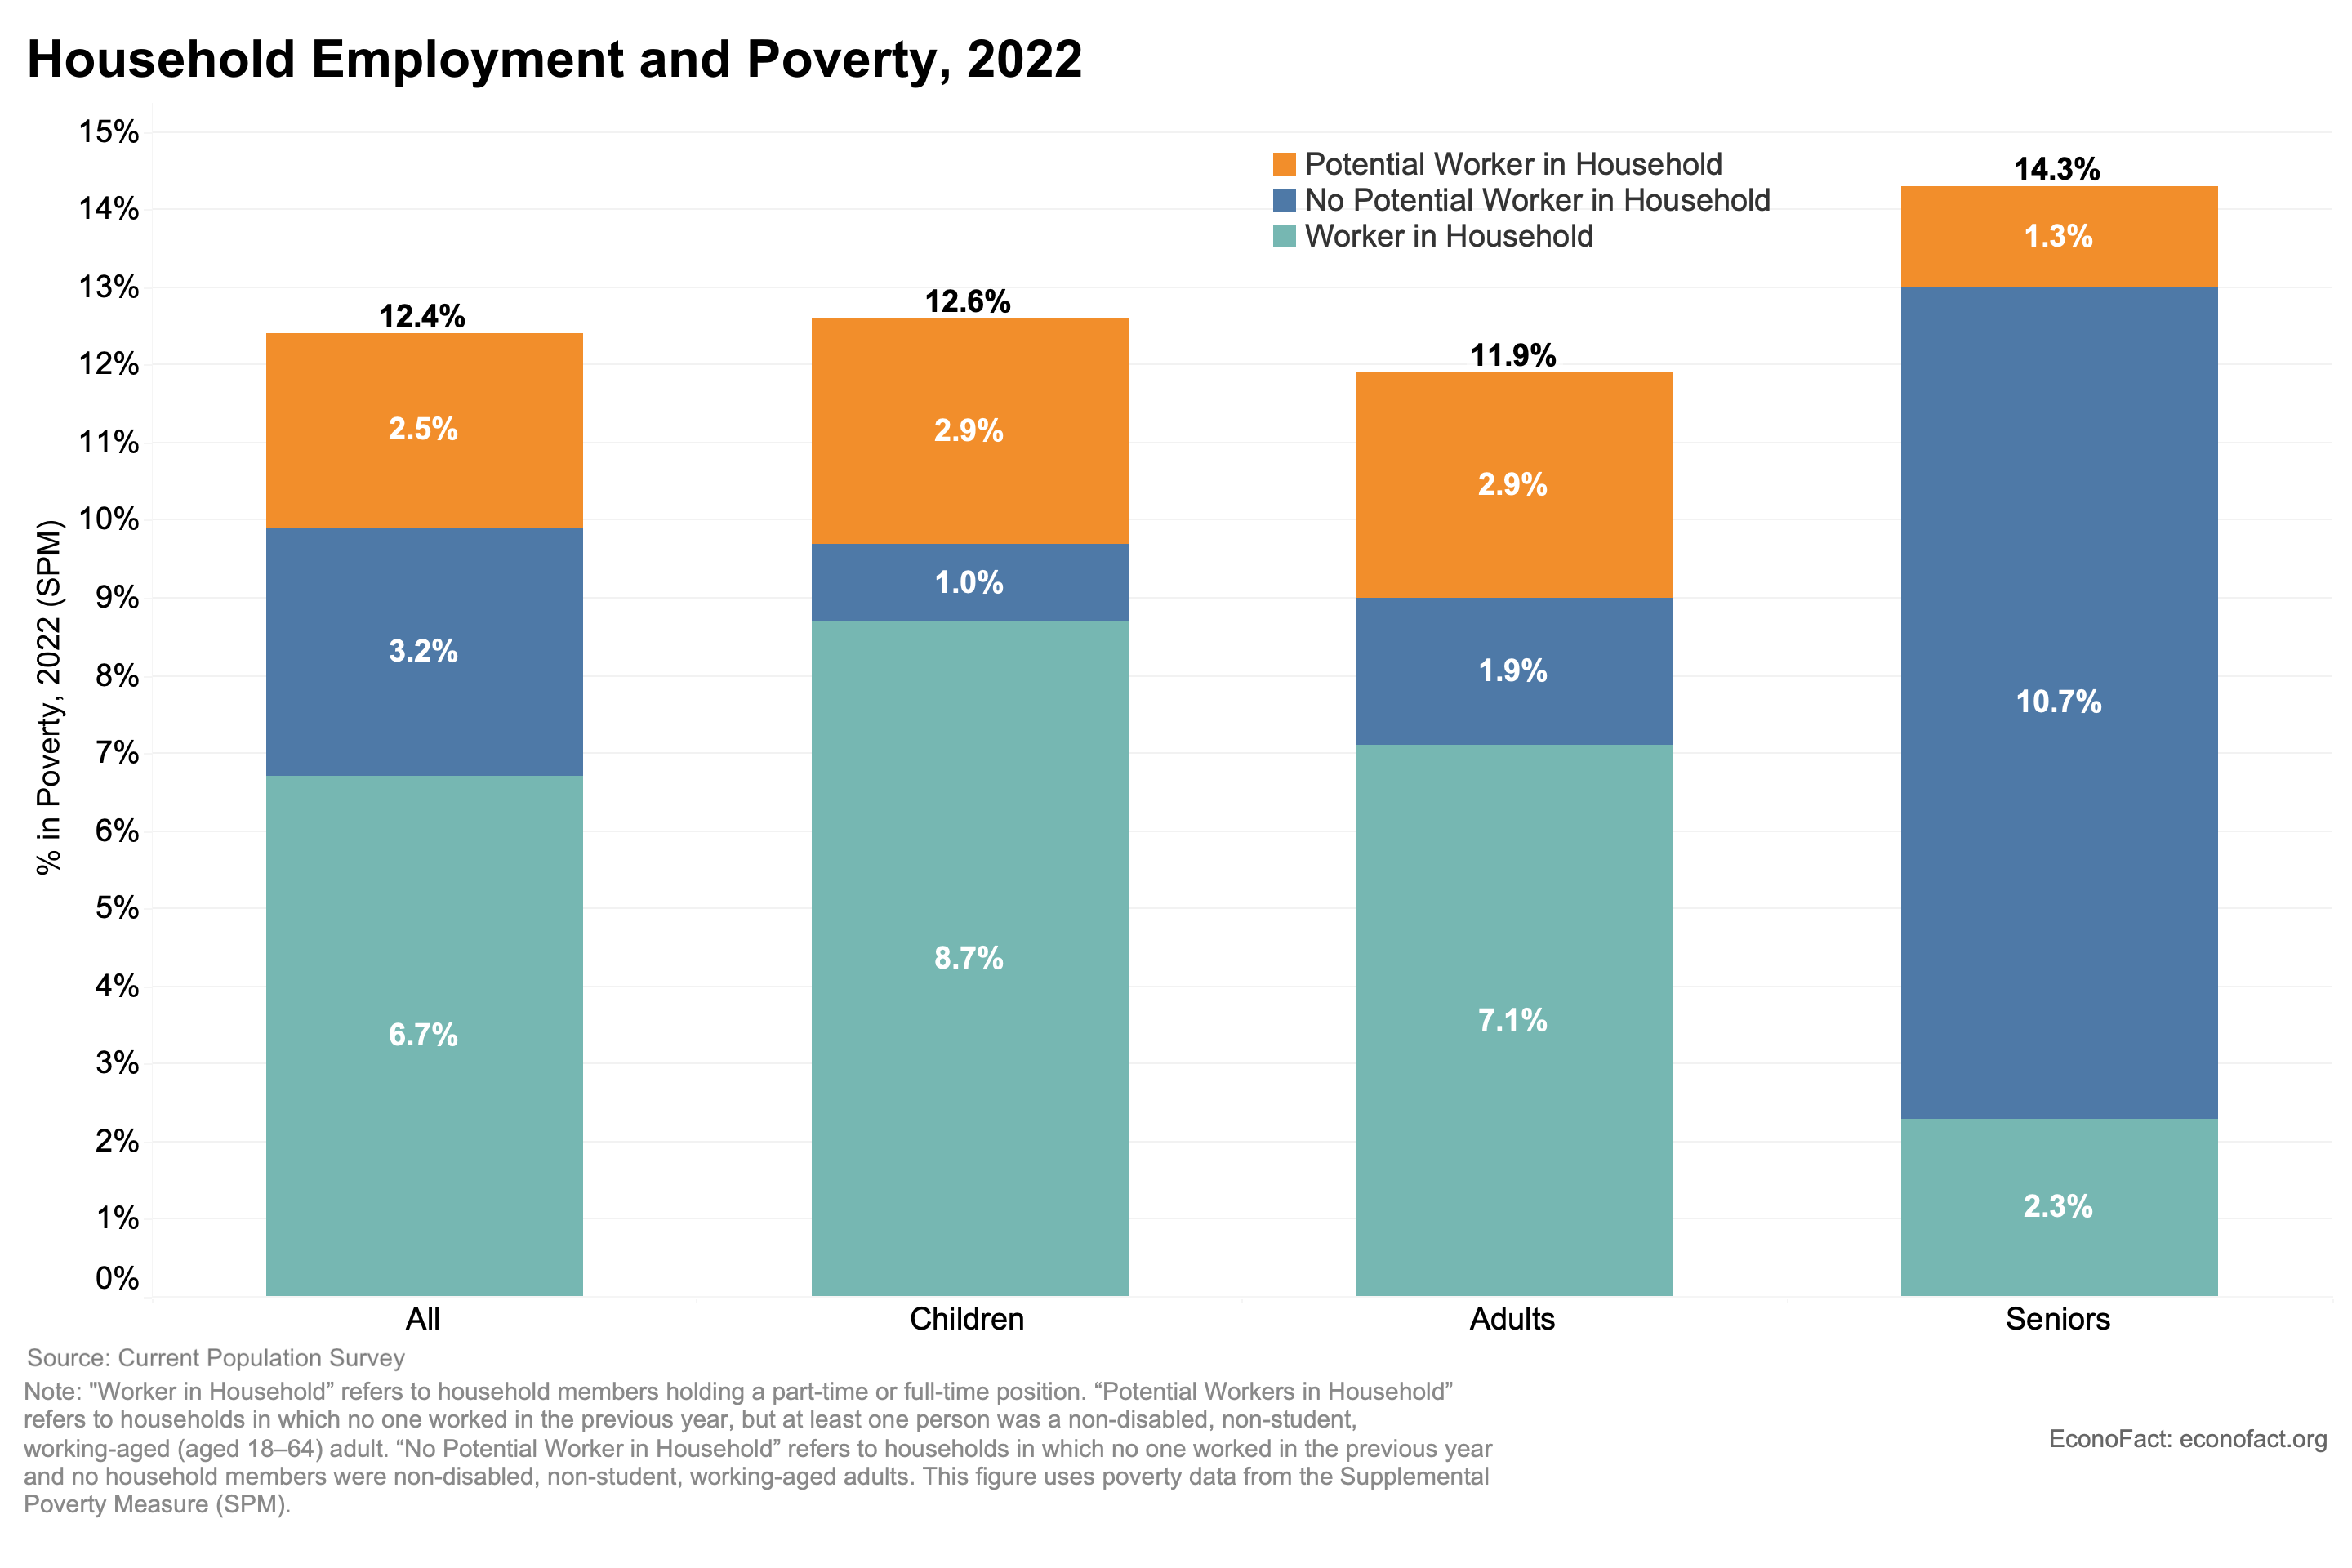
Most people in poor households work, live with someone who works, or face barriers to employment.
The Facts:
- There were 40.9 million people living in poverty in the United States in 2022. The poverty rate increased to 12.4% in 2022, up from 7.8% (25.6 million people) in 2021, as measured with the Supplemental Poverty Measure (SPM). The large increase in 2022 was due to the expiration of benefits from expanded pandemic assistance, as well as inflation pushing up poverty thresholds. The federal government’s Covid-19 response — including the Child Tax Credit, stimulus payments, and expanded Earned Income Tax Credits (EITC) — had temporarily driven the poverty rate to a record low in 2021 as measured by the Supplemental Poverty Measure, which adjusts incomes for government assistance programs, taxes, work and medical expenses, and regional differences in costs of living. (The official poverty rate remained stable in 2022 (11.5%) compared with 2021 (11.6%) as it does not take into account the factors mentioned above.)
- With the exception of seniors, employment is common among households in poverty. Our analysis of the 2023 Current Population Survey (CPS) shows that 6.7% of all people were below the poverty line and they either worked during the year or lived in a household with someone who did (see chart). Most poor children (under age 18) lived with someone who worked: 12.4% of children were poor in 2022, and 8.6% were poor while living with someone who worked during the year. Similarly, most poor working-aged adults (ages 18–64) either worked or lived with someone who did: 11.9% of working-aged adults were poor, and 7.2% were poor while working or living with someone who worked. In contrast, most seniors (at least 65 years-old) in poverty did not work, live with someone who worked, or live with any potential workers (non-disabled, non-student adults of working age): 14.2% of seniors were poor, and 10.6% were poor while living without any potential workers in their households.
- There are many barriers to employment among the working-aged adults who do not work. Among all working-aged adults in poor households, 42.5% worked in the previous year, 16.5% were ill or disabled, 14.2% were taking care of the home, 10.1% were retired, 9.2% were going to school, 3.2% could not find work, and 4.2% did not work for some other reason.
- Working poverty — measured as the SPM poverty rate among people in households in which at least one person worked in 2022 — is more common for racial and ethnic minorities. The poverty rate among non-Hispanic white people in households in which at least one person worked was 5% in 2022. In contrast, the working poverty rate was 3 times higher (15.2%) among Hispanic people and over two times higher (10.6%) among non-Hispanic Black people. The working poverty rate was 9% among non-Hispanic Native Hawaiian/Pacific Islanders, 8.4% among non-Hispanic American Indian/Alaska Natives, 6.7% among non-Hispanic Asian people, and 5.4% among non-Hispanic multiracial people. These disparities reflect many factors and persistent systemic processes — including racial discrimination and broader structural racism —that cause disparities in access to stable, high-paying jobs.
- Working poverty is higher in households headed by single adults than those headed by couples. The working poverty rate was 16.9% for single-parent households compared to 6.7% for couple-headed households with children (including married or cohabiting) in 2022. Among households without children, the working poverty rate was 9.9% for single adults and 5.2% for coupled adults.
- Households with more total working hours have lower rates of poverty. In households where someone worked but the household’s total employment was less than 40 hours/week for 52 weeks, the SPM poverty rate was 27.8% in 2022. This marks a sharp contrast with households in which the total employment was over 40 hours/week for 52 weeks: the SPM poverty rate was 4.9% for people in households with at least one full time equivalent (FTE) worker in the previous year. This difference in poverty rates reflects a long-term trend in the growing importance of employment for families’ poverty status. However, many households collectively work less than one full time equivalent because full-time, full-year employment is increasingly unavailable for low-wage workers. Among people in poor households who worked part-time or part-year in 2022, 22.3% worked part-time or part-year because they could not find full-time work or due to illness/disability.
- Both higher wages and greater access to full-time, full-year employment are necessary for employment to effectively keep people out of poverty. The income needed to make the poverty threshold increases with household size. At the current federal minimum wage of $7.25/hour one full-time, full-year worker could not reach the median SPM poverty line for any household with more than one person. At $15.00/hour —an ongoing federal minimum wage target for advocates and policymakers — a household with two adults and two children would reach the median SPM poverty line with one full-time, full-year worker (40 hours/week, 51.8 weeks/year).
What this Means:
Work requirements are intended to promote employment among the poor, but most people in poor households work, live with someone who works, or face barriers to employment. Work requirements for welfare programs do not meaningfully encourage long-term employment for a population that is often already working but in jobs which do not often provide stable hours or living wages. Safety net programs can lift people out of poverty when they are unable to find stable, full-time employment. However, unpredictable employment and fluctuations in work hours undermine both overall earnings and workers’ abilities to meet some work requirements for public benefits. Stricter work requirements would exacerbate the impact of employment instability on poverty.
Like what you’re reading? Subscribe to EconoFact Premium for exclusive additional content, and invitations to Q&A’s with leading economists.