Employment and Poverty
UC Davis and Center for Poverty Research
The Issue:
For the past two decades, U.S. anti-poverty policy has coalesced around the idea that work should be at the center of anti-poverty programs. Bi-partisan welfare reform in the 1990s focused on work requirements and time limits. The growth and popularity of the Earned Income Tax Credit (EITC), which increases the after tax income for those working near the bottom of the wage distribution, has also emphasized the importance of work. Recently, proposals to require work for those receiving a variety of benefits, including Medicaid, SNAP, and public housing, continue this employment focus.
It is important to understand how many of those who are poor are able to work, and to what extent working allows people to escape poverty.
The Facts:
- Of the 40.6 million Americans living in poverty in 2016, 56.1 percent were working-age adults, 18 to 64. Important shares of those living in poverty are children and adults aged 65 and older (32.6 percent and 11.2 percent respectively, in 2016).
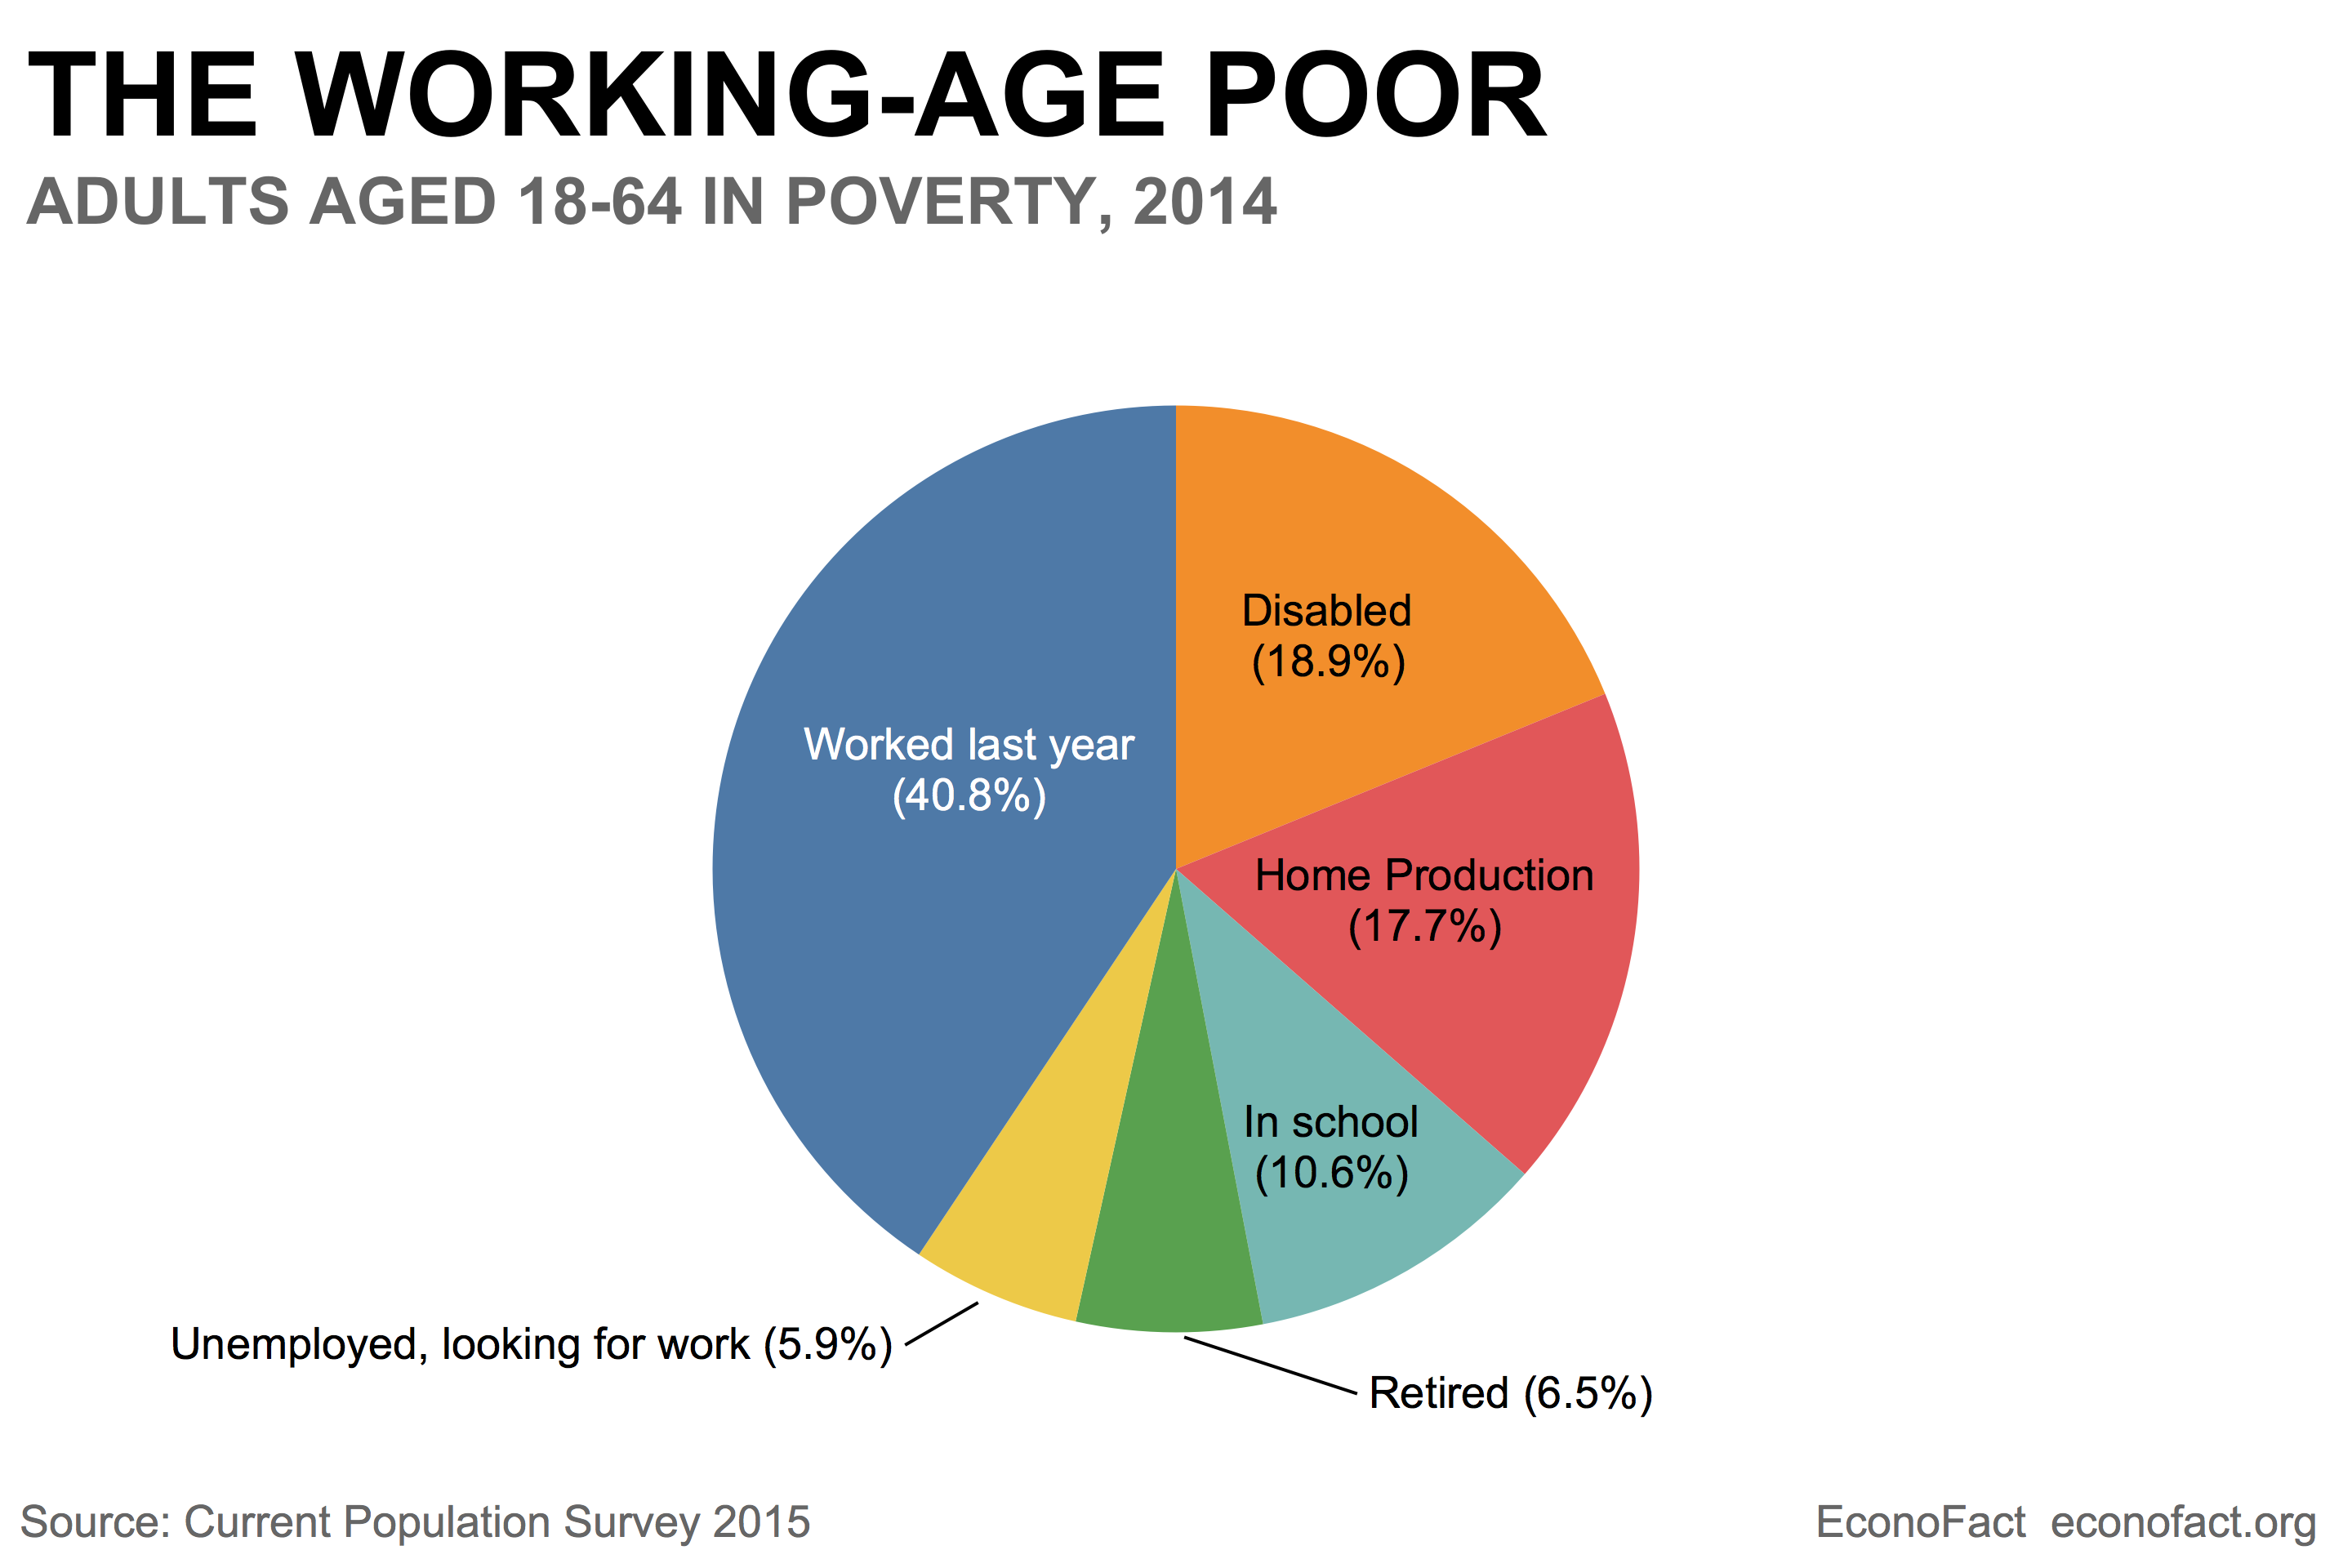
- Among the poor aged 18 to 64, 40.8 percent worked for some part of the year and many of those not working reported barriers to paid work, or reported engagement in other productive activities in 2014. Using Current Population Survey data, I calculate that 18.9 percent of the poor ages 18 to 64 did not work due to disability, 10.6 percent were in school, and 5.9 percent were unemployed and looking for work (see chart).
- The poverty rate among those engaged in the labor force for more than half of the year is much lower than for the population as a whole: the working poverty rate, as defined by the U.S. Bureau of Labor Statistics (BLS), was 5.6 percent, compared to a total poverty rate of 13.5 percent in 2015. This means that, in 2015, an estimated 8.6 million people were "working poor" according to this BLS definition, or had income below official poverty thresholds despite working (or looking for work) for more than half the year (see here).
- Among families with children, the working poverty rate is substantially higher, reflecting the higher poverty thresholds associated with larger families. These figures rely on the official U.S. poverty measure, which is determined by a household’s pre-tax income and also takes into consideration household size; for example, in 2016, a family of four earning less than $24,300 would be considered poor (see here). In 2015, among households with children under the age of 18, the working poverty rate was 11.1 percent. Among single-female headed families with children the working poverty rate was 24.8 percent (see Table 5).
- Part-time (and part-year) employment, common among the working poor, reflects a mix of non-economic and economic (demand-driven) conditions. In 2016, approximately 17 percent of part-time workers reported economic, or demand-related, reasons for their part-time status. These workers wanted to work full-time but could not find full-time employment due to slack business conditions or other reasons. Non-economic reasons for part-time work included caring for children or other family obligations (17 percent); health or medical limitations (3 percent); and being enrolled in school (18 percent). (See here).
- The official poverty thresholds do not take into account some important factors, including childcare costs, which have a large impact on disposable family income. The Supplemental Poverty Measure (SPM) addresses shortcomings of the official poverty measure and thus offers a more complete view of working poverty. Among other changes, the SPM subtracts work related expenses and childcare costs from the income measure used to calculate poverty status. Using the SPM measures leads to higher estimates of poverty rates. In 2015, among those working full-time and full-year the (SPM) poverty rate was 4.7 percent. Among those working any amount during the year the SPM poverty rate was 8.3 percent. The SPM calculations are important since child-care costs can make up a substantial fraction of household income for low-income families. Among families with any amount of child-care expenditures, average annual spending on childcare in the years 2012 to 2015 was $6,558, or 8.8 percent of total income. Among poor families with child-care expenditures, annual childcare spending was $2,547, and accounted for nearly 20 percent of total income.
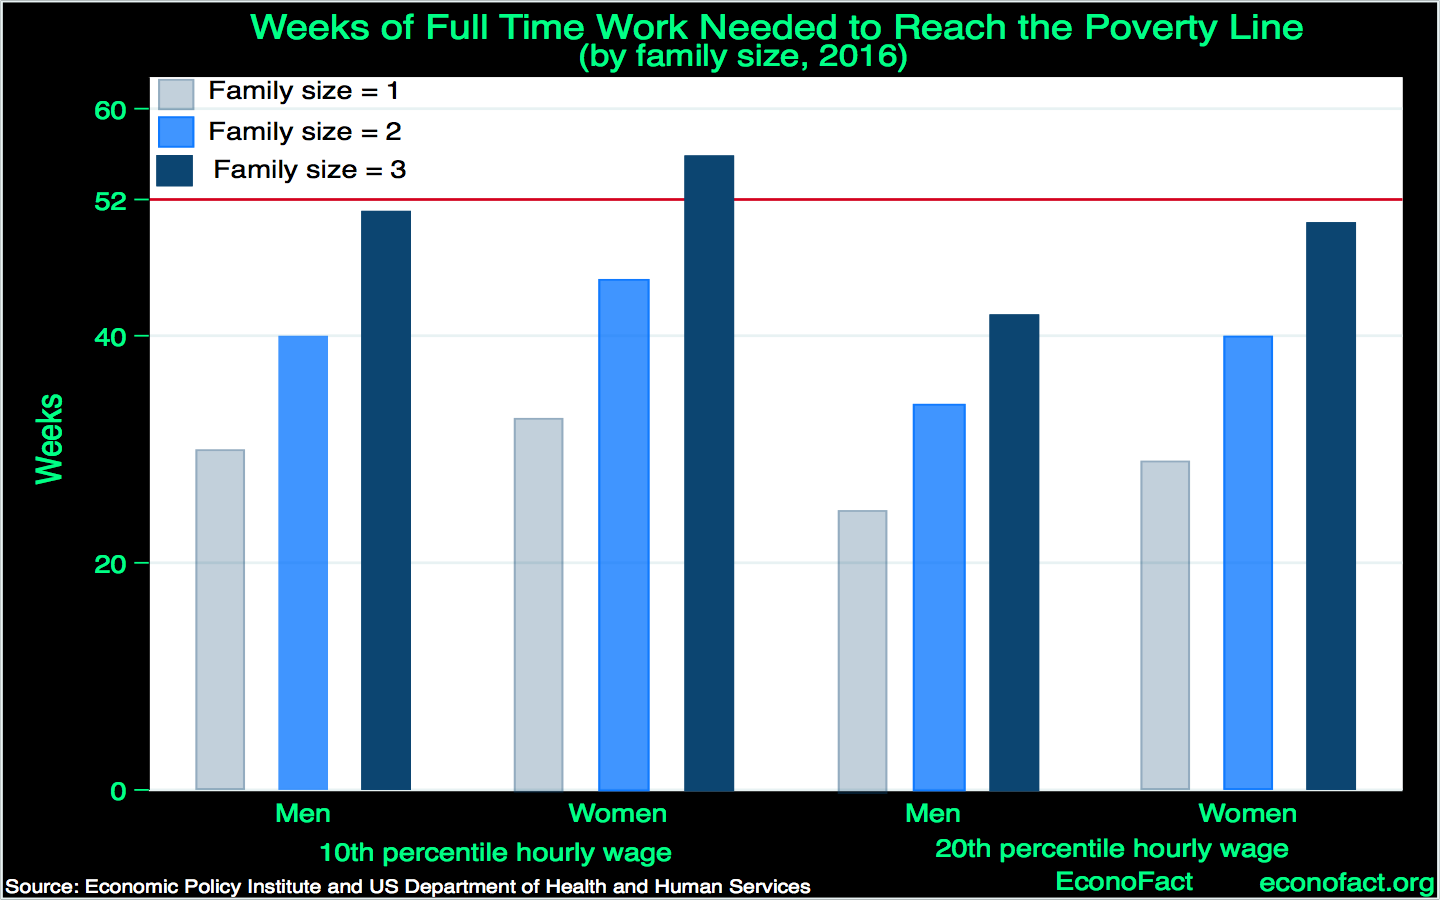
- Low wages at the bottom of the earnings distribution and the low probability of working full-time for a full year in low wage jobs increase the risk of poverty for workers. For the bottom 10 percent of wage earners, around 30 weeks of full-time work per year are needed to generate earnings equal to the poverty line for a single individual. For a family of three, 50 or more weeks of full time work would be required to reach the poverty line. The relationship between weeks of work at different wage levels and the poverty threshold for different family sizes is shown in the chart below. Slightly higher in the distribution of wages, at the 20th percentile of hourly wages, between 25 and 30 weeks of work are needed to produce earned income equal to the poverty line for a single individual, and 40 to 50 weeks of work are needed for a family of three.
What this Means:
Calls to increase work requirements among those receiving government assistance should recognize that most poor adults are already working, looking for work, or are disabled or ill. Increasing work among the poor may require addressing barriers to work including work-limiting disability or illness. While work may be a policy goal on its own, requiring work will not necessarily raise families above the poverty line. Given the level of wages in the lower fifth of the wage distribution, many workers, especially those who are parents, will need 50 weeks or more of full-time work to reach the poverty line.
Like what you’re reading? Subscribe to EconoFact Premium for exclusive additional content, and invitations to Q&A’s with leading economists.