Understanding The Medicaid Program
Harvard Kennedy School
Executive Summary
Medicaid is a joint federal-state health insurance program that covers over 75 million low-income and disabled Americans as of January 2026. Medicaid, along with the closely linked Children’s Health Insurance Program (CHIP), is by far the largest social safety net program in America and one of the largest items on state government budgets. (About 10 percent of enrollees – 7.2 million – are children in CHIP. This brief will follow the convention of treating Medicaid and CHIP as bundled programs.)
Medicaid is the nation’s largest health insurance program by enrollment and the second largest by spending at $919 billion in total costs in 2024 – of which 65% ($594 billion) is paid by the federal government and the other 35% ($325 billion) by states. Medicaid plays a unique role in America’s health insurance system as the main insurer for the poor (especially poor children), for people with severe disabilities, and for people needing nursing homes and other long-term care.
Medicaid features prominently in recent national debates about health care coverage and costs. At the center of these debates are core tradeoffs about how to balance coverage, cost, access, and federalism — and how new rules and budget choices could reshape each.
This brief gives an overview of Medicaid, summarizing its background and history, giving an overview of how it works today, and highlighting key policy debates.
I. Background and History
Creation and Expansion: Created in 1965 alongside Medicare (the health insurance program for seniors age 65+), Medicaid initially was a small program mainly for welfare recipients. Over time, it grew into the largest health insurance program in America, covering 70+ million Americans and costing over $900 billion. This expansion was gradual and a result of a mix of state and federal policy choices, with one key (and controversial) one being its expansion under the Affordable Care Act since 2014. The chart below shows (inflation-adjusted) spending and enrollment over time, highlighting key policies including the expansions to pregnant women and kids in the late 1980s-90s, Medicaid’s de-linking from welfare in the 1996 Welfare Reform law, and rapid growth after the introduction of CHIP (1997), the ACA’s expansion (2014), and Covid-era pauses on verifying Medicaid eligibility (2020-23).

Medicaid is a health insurance program. Health insurance is a way to help people pay for the (uncertain) costs of health care. When someone gets sick or needs preventive care or medications, health insurance “covers” all or part of the bill. Relative to being uninsured, health insurance benefits recipients with financial risk protection against large medical bills and greater ability to afford and access medical care. This better access has been shown to improve enrollee mental health and ultimately save lives. But it also comes at a cost of higher medical spending to the system overall. (Some have argued that health insurance might reduce overall spending by keeping people healthier, thereby preventing expensive hospital and ER visits. While health insurance does appear to improve health, almost all studies find that the effect is not large enough to make it a money saver on net.) With Medicaid, these greater costs are borne by taxpayers, since Medicaid is free to enrollees.
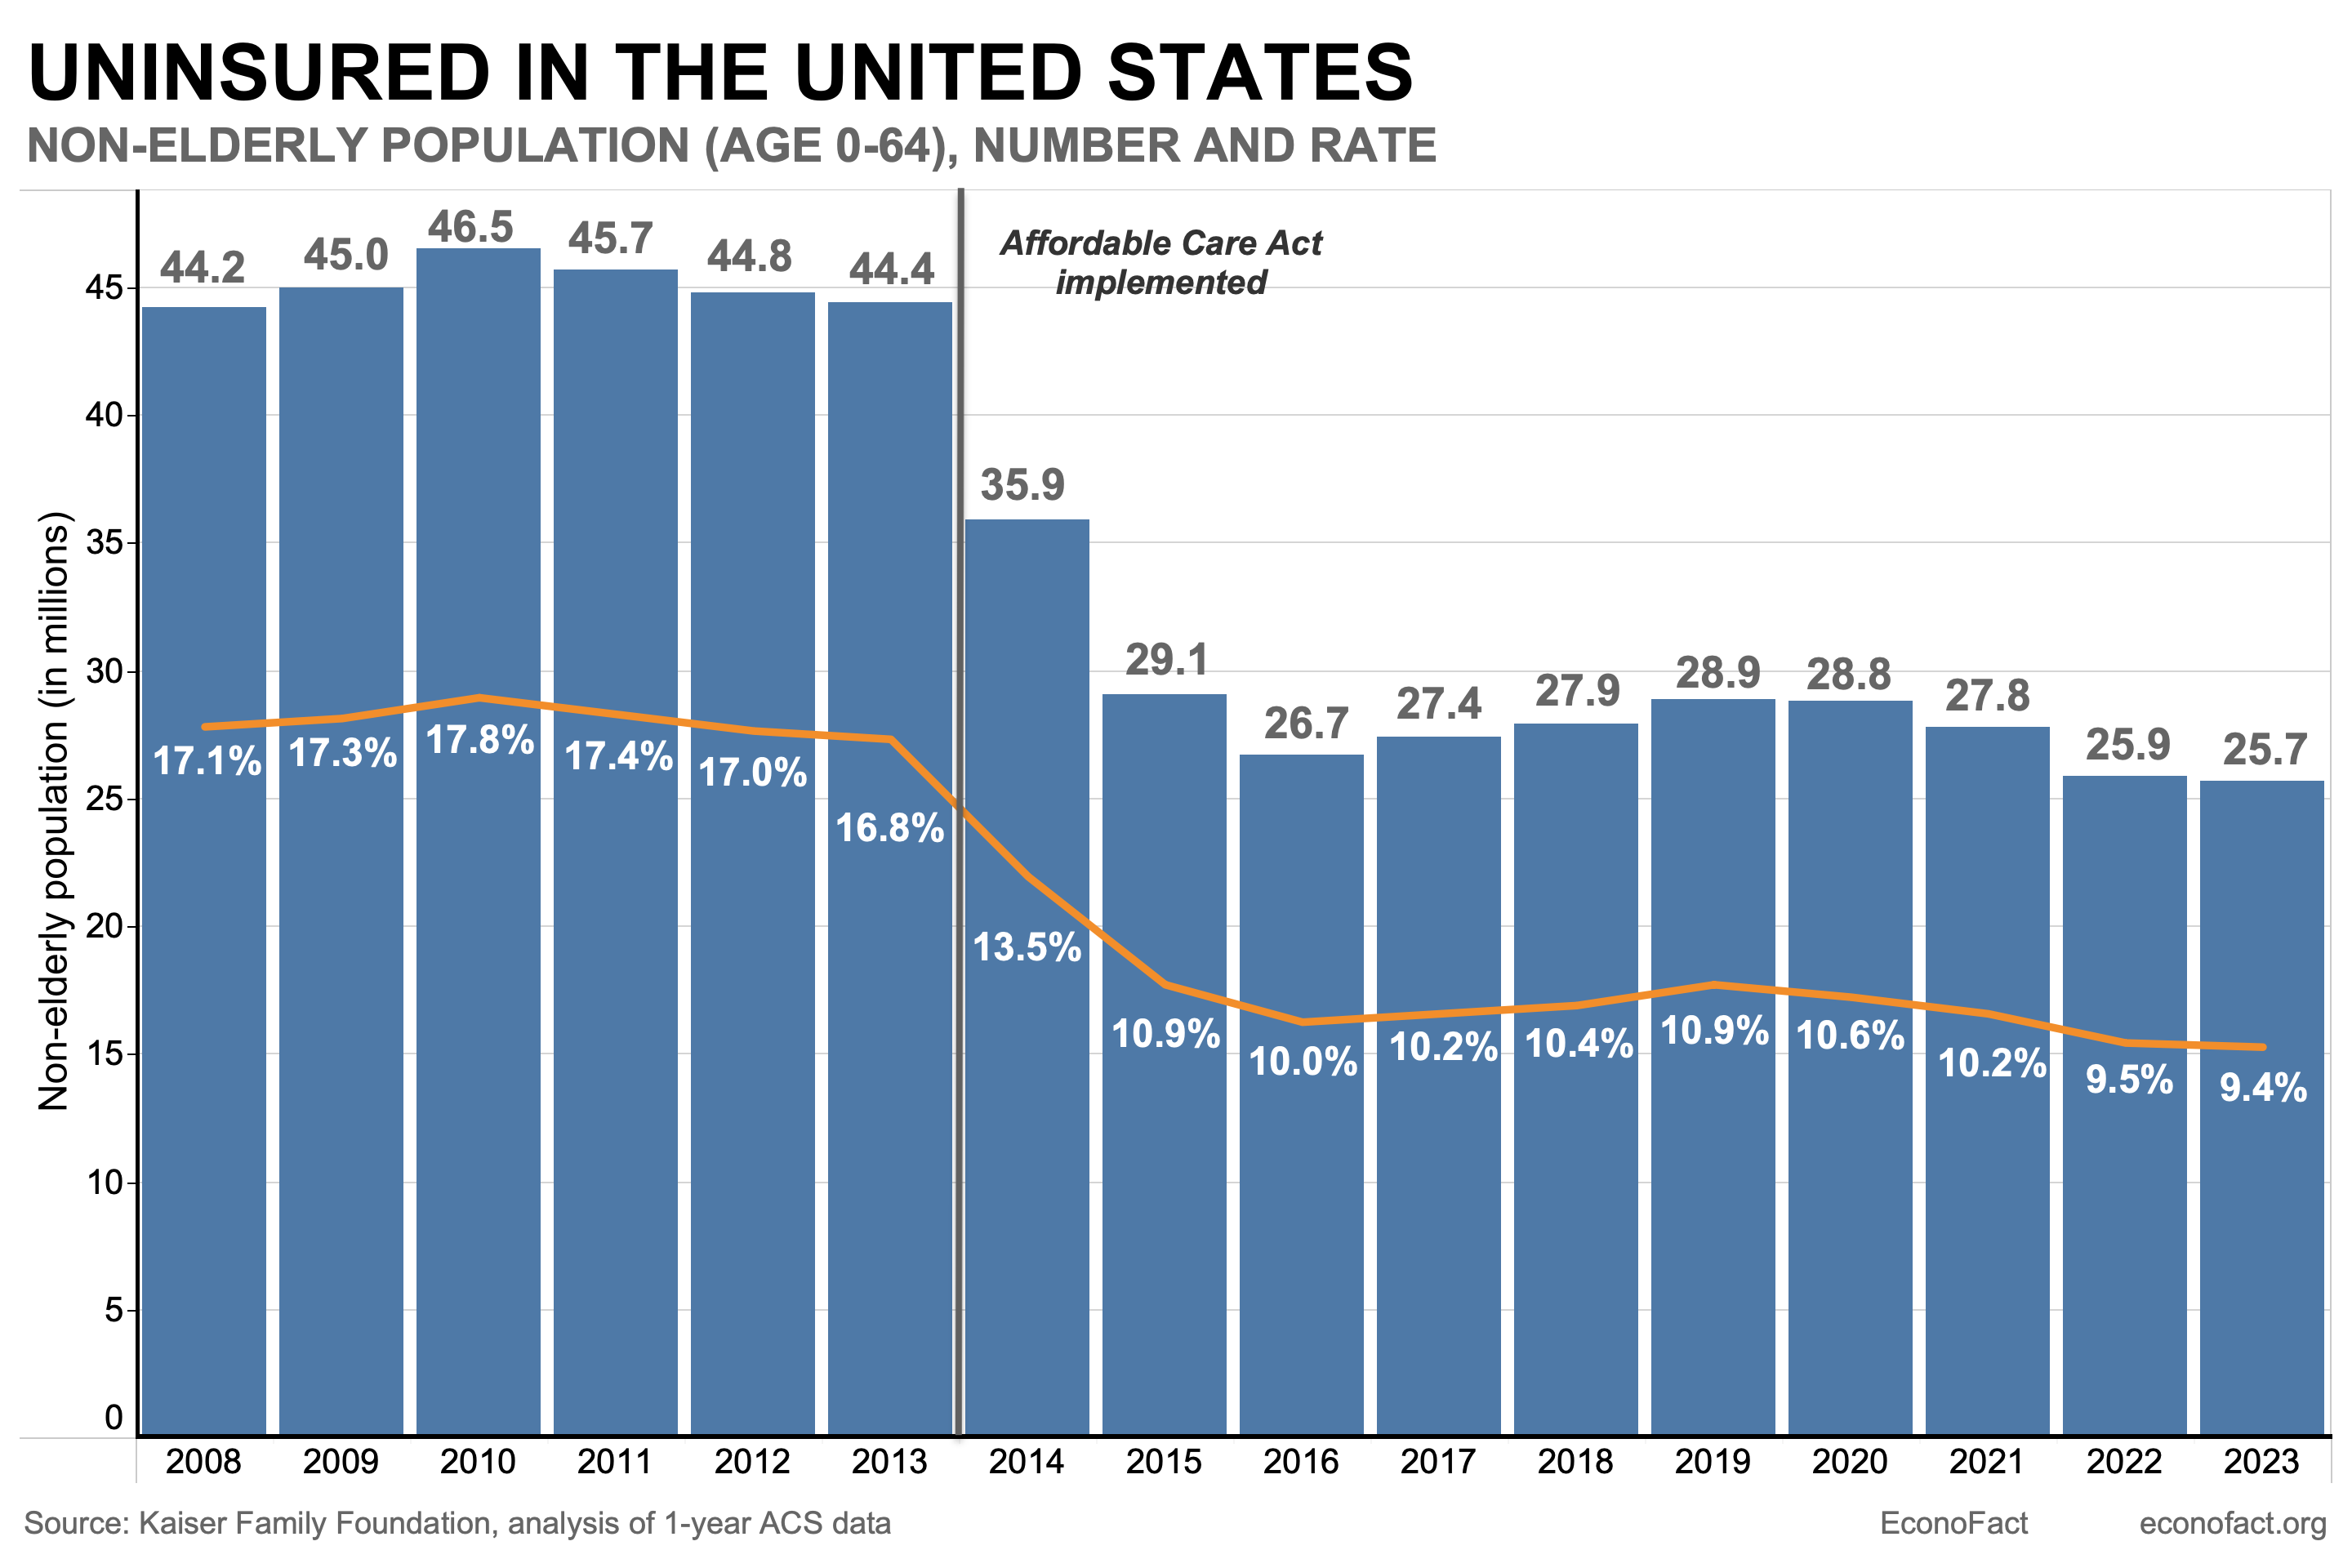
Medicaid is one form of health insurance within America’s complex system. Unlike other high-income nations, the U.S. does not have a single unified system for giving people health insurance. Instead, Americans get coverage from a patchwork of sources, and about 8% of people (27 million Americans) are uninsured. The chart below visualizes this fragmented health insurance landscape, showing the main source of coverage by age and income group, and coverage shares overall.
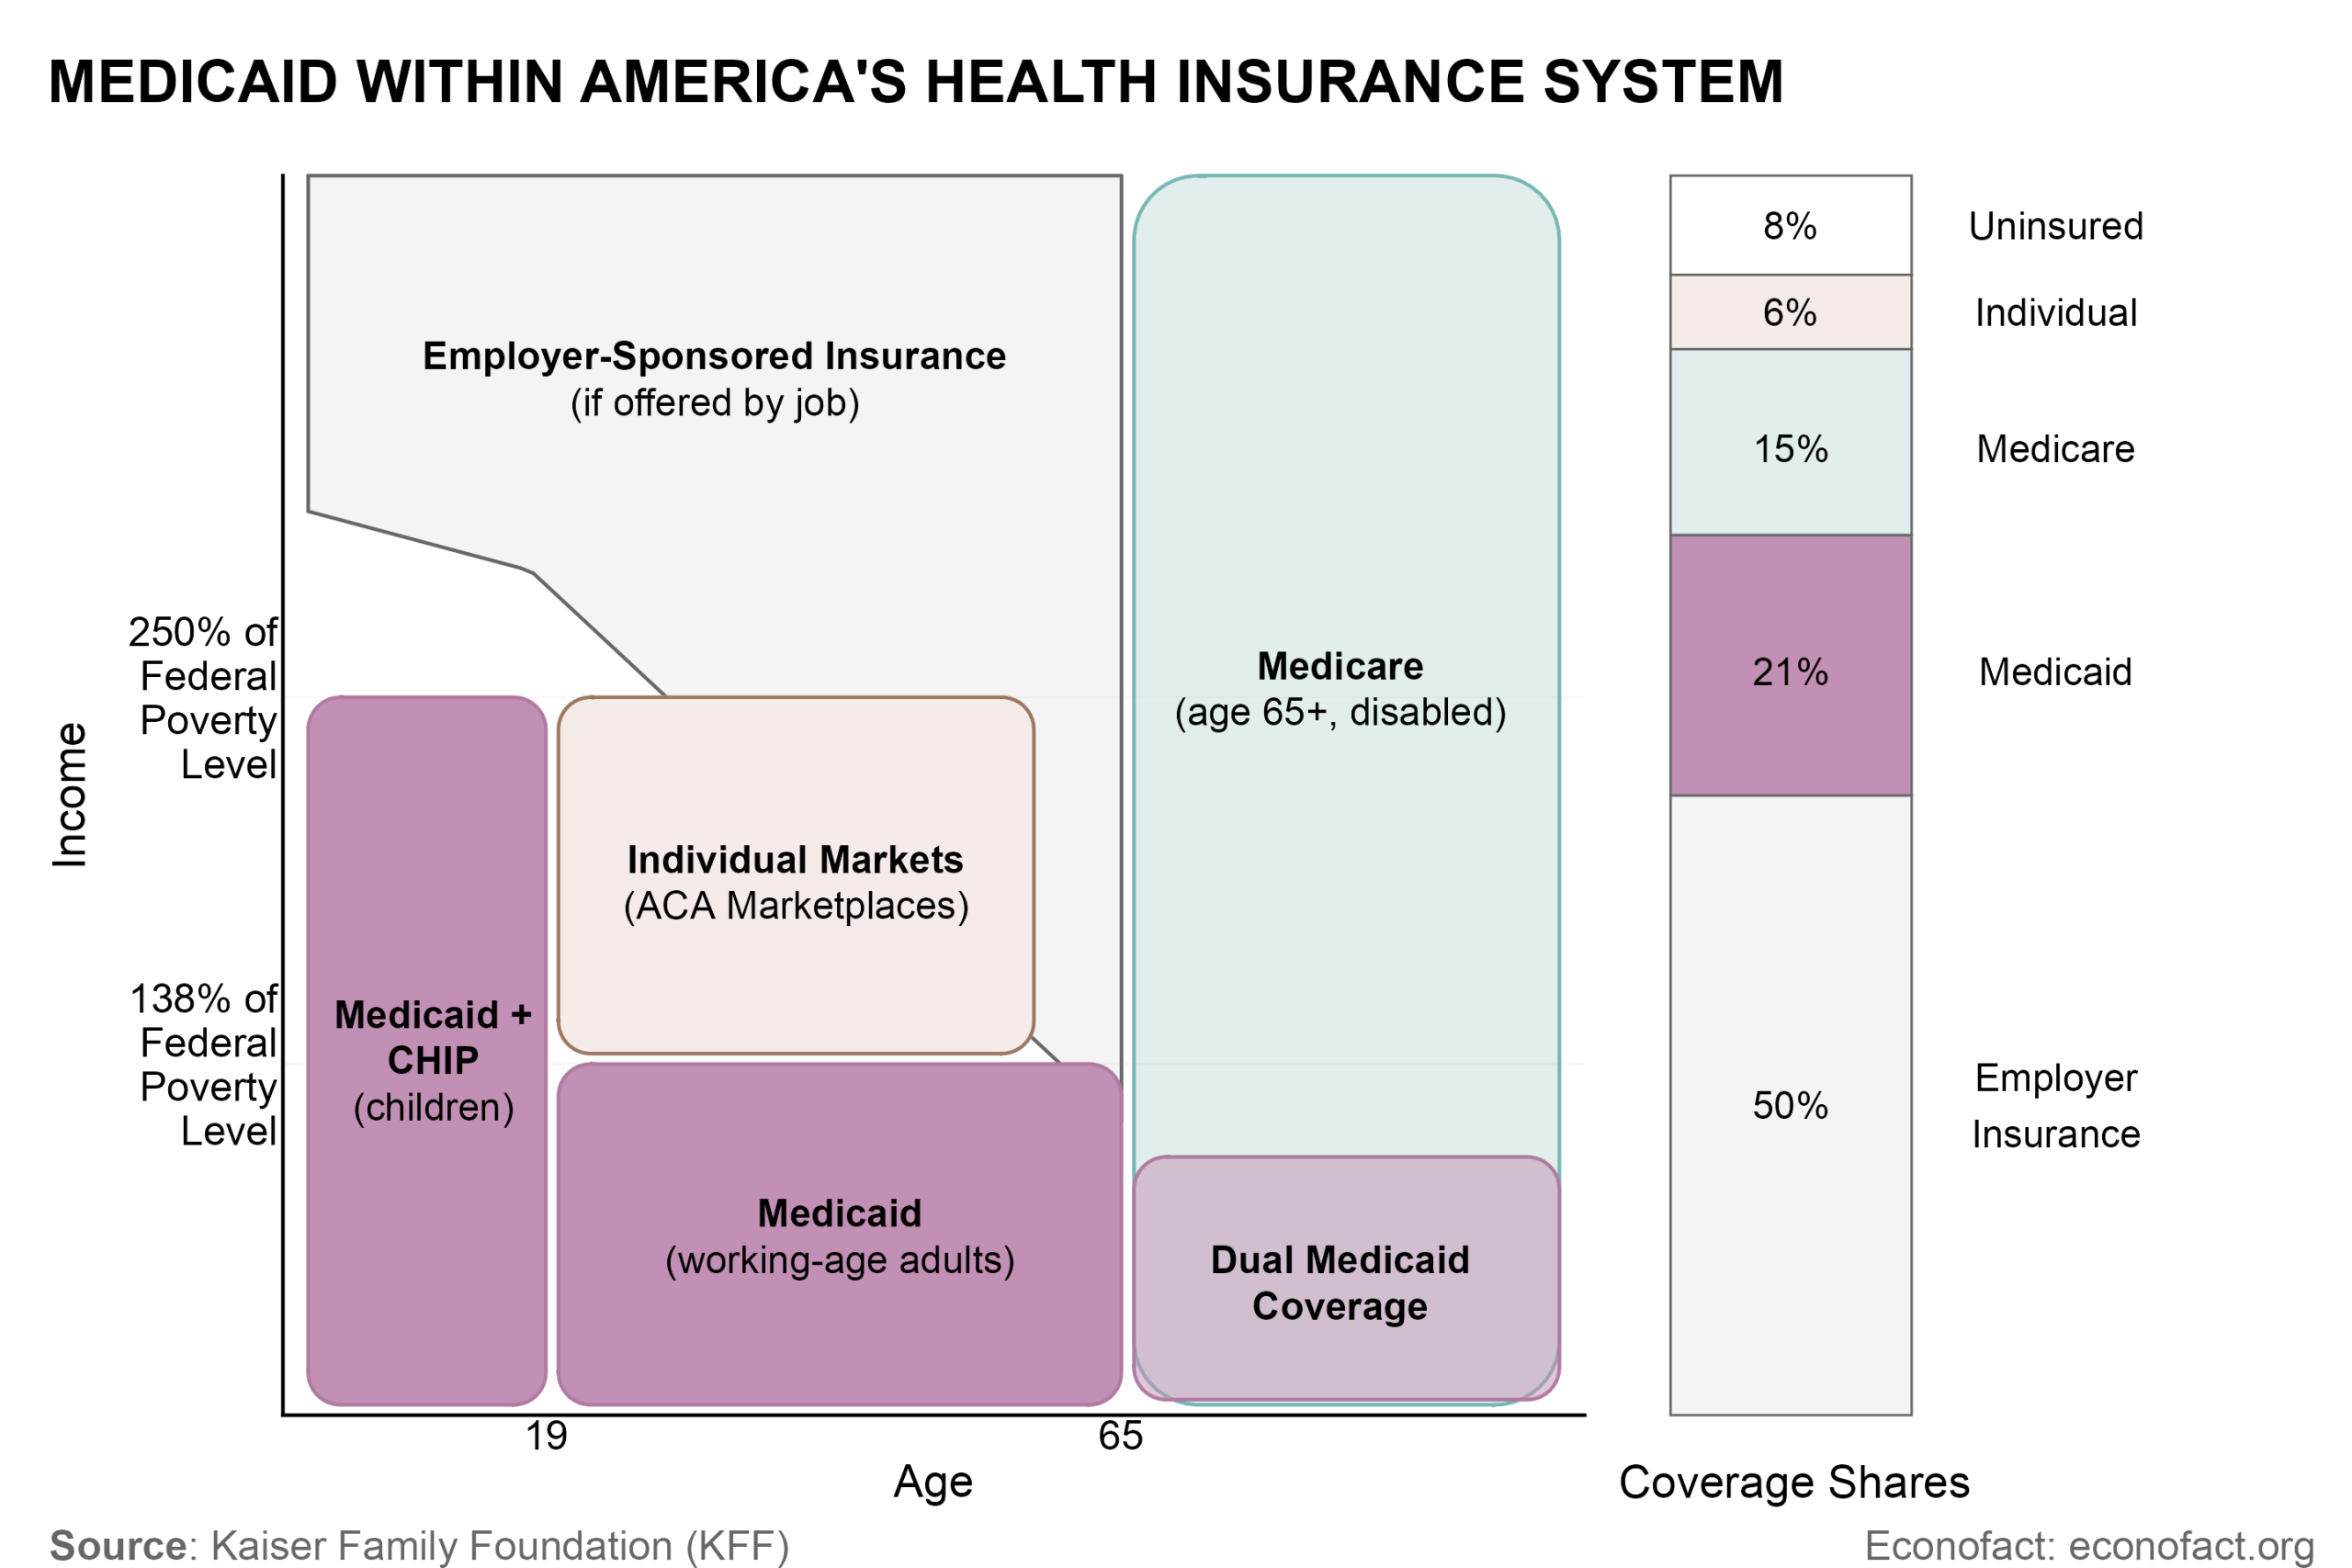
Medicaid plays a unique role as America’s “safety net” insurer. Medicaid covers the poorest Americans and provides benefits like long-term care (e.g., nursing homes) that other health insurers don’t cover. Medicaid is the main insurer for poor kids and poor working-age adults, and it provides supplementary coverage on top of Medicare for poor seniors and people with disabilities. One of Medicaid’s key challenges is that it is such a complex and diverse program, covering very different services and populations within a single entity.
Medicaid is low-cost per person but expensive overall. On a per-person basis, Medicaid is one of the lower-cost forms of health insurance in America, largely because it pays low prices for doctors, hospitals, and prescription drugs. Medicaid prices for physician services are on average 25% below fees in Medicare, which in turn pays substantially less than private insurers. Medicaid fees vary widely across states. Despite this, Medicaid is quite expensive overall because it covers so many people and so many of the sickest Americans. This paradox creates a difficult dilemma for policymakers. On the one hand, Medicaid is straining state budgets, making cost control a priority. On the other hand, further cost cuts tend to anger physicians and hospitals, who are already concerned about how little Medicaid pays them (and are less likely to accept Medicaid than private insurance). Navigating this cost dilemma is a key challenge in coming years.
II. How Medicaid Works Today
Medicaid is a complex program. This section provides a brief tour of how it works from several angles: (1) who it covers, (2) what benefits it covers, (3) federal and state roles in financing and running it, (4) public and private roles in delivering it.
Who Does Medicaid Cover?
Medicaid covers four main low-income groups:
Children: Through Medicaid and its sister CHIP program, Medicaid covers about 35 million kids – almost half of all American children. It also covers about 40% of all births. Income limits for kids (and pregnant women) are higher than for other groups, with Medicaid typically available up to family income of 200-250% of poverty (varying by state).
Working-age adults: Medicaid covers about 39 million adults of working ages (under-65), about 17% of this population. While exact rules differ by state, Medicaid is available to people up to 138% of poverty (about $22,000 for an individual, or $44,000 for a family of four) in the 40 states that have expanded it under the ACA. Although this “ACA expansion” population has been controversial, this group comprises only about 25% of Medicaid beneficiaries. Another 20% are working-age adults who would qualify even without the ACA.
Poor seniors and people with disabilities: Medicaid provides secondary coverage for 13 million poor seniors and people with disabilities who also have Medicare – a group called the “dual eligible” population. Medicaid covers cost sharing and other services that Medicare does not cover. Dual eligibles must have low incomes and low assets, typically below $2,000 to $3,000 for the household.
Long-term care patients: Medicaid is the dominant payer for nursing homes and other long-term care (LTC), which is not covered by Medicare. Because LTC is so expensive, many American seniors exhaust their entire retirement savings paying for it, and Medicaid then steps in to cover costs as long as needed. Because of this structure, many Americans who were middle- and upper-income during their working years go onto Medicaid for a period near the end of their lives.
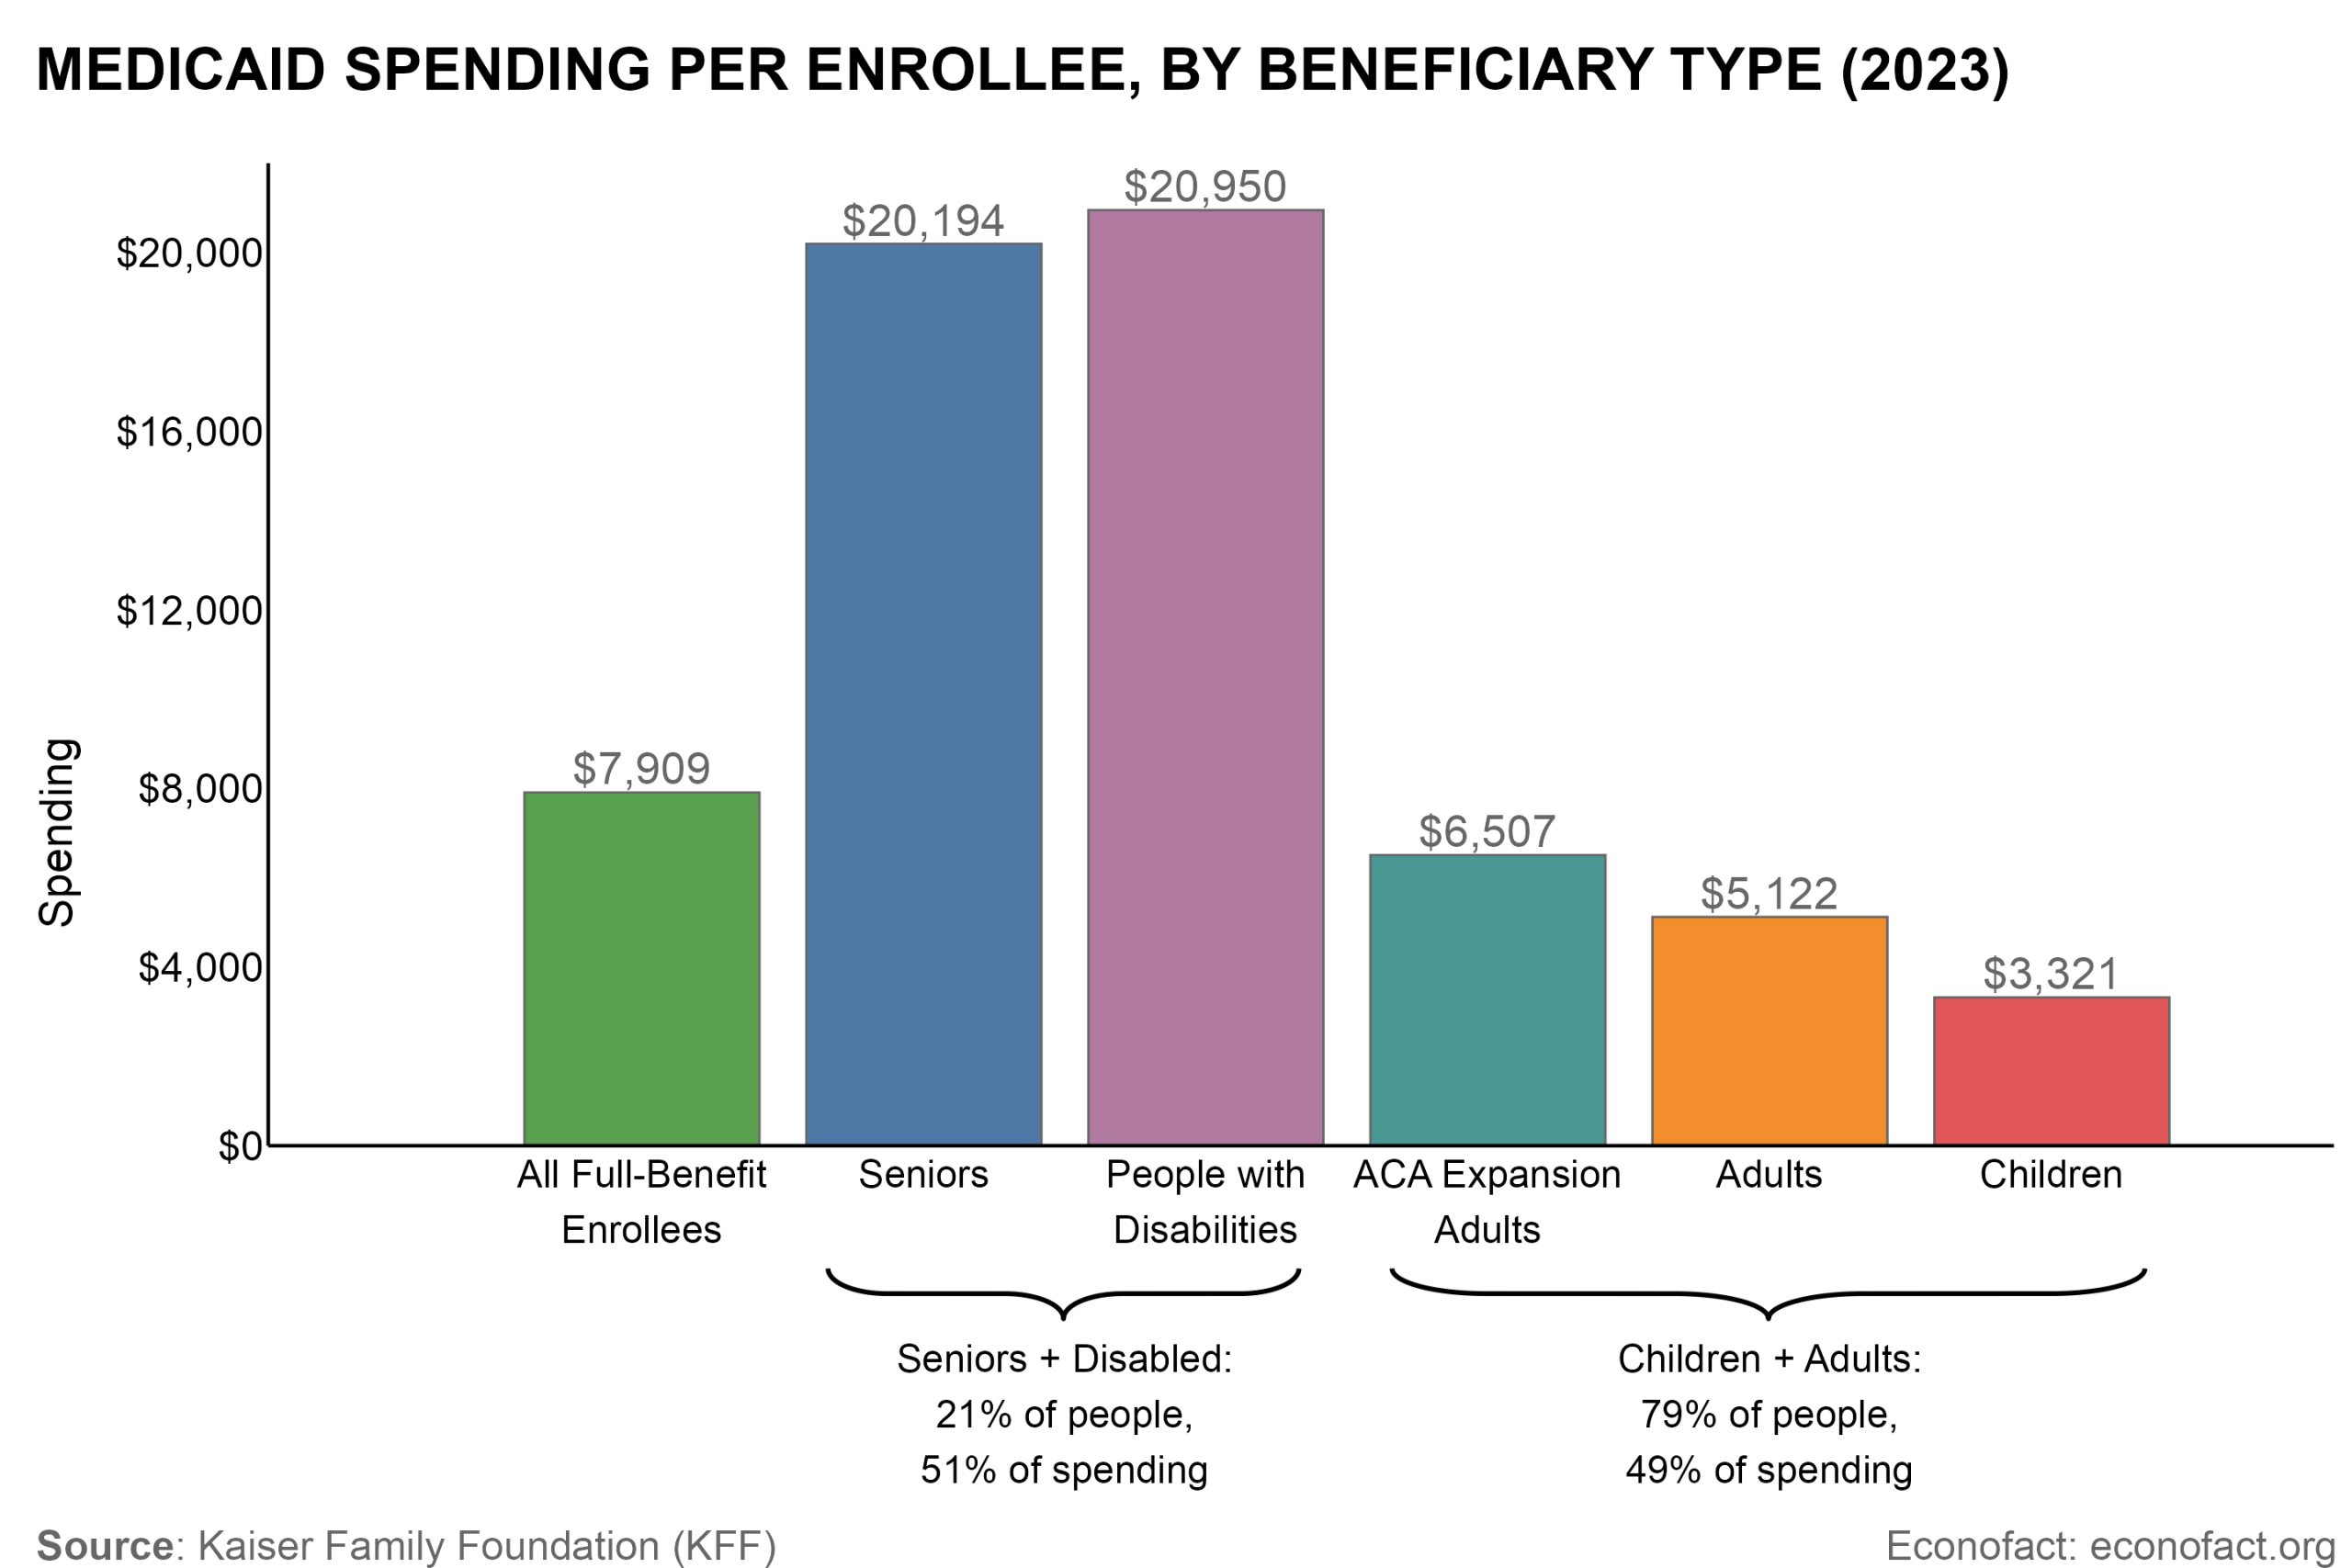
While most Medicaid beneficiaries (about 80%) are kids and working-age adults, just over half of Medicaid spending is on seniors and people with disabilities (who are about 20% of enrollees). This is because seniors and people with disabilities are in much worse health (and therefore more expensive) than adults and children. The chart above shows average per-enrollee Medicaid spending for these groups. The average senior and person with disabilities costs over $20,000 per year — more than three times the average adult ($5,000 to $6,500) and six times the average child ($3,300). This reflects the fiscal reality of health programs: the vast bulk of spending occurs on a small share of the most vulnerable enrollees who are in poor health. (The $20,000 spent on average per year on seniors and persons with disabilities is just what Medicaid pays and it is on top of substantial Medicare spending for this group.)
It is important to note that most of Medicaid’s growth in recent years comes from expansions among lower-cost populations of children and adults. As a result, per-beneficiary Medicaid spending (after adjusting for inflation) has been flat or declining for the past 25 years. For instance, real per-beneficiary spending was $10,831 in 1999 and $9,109 in 2023 (see chart below).

What Benefits Does Medicaid Cover?
Medicaid works like standard health insurance in that it helps enrollees pay for medically necessary health care, covering a broad range of standard medical services like physician care, hospital care, preventive care, post-hospitalization rehab care, and prescription drugs.
But Medicaid covers a broader scope of benefits than most health insurance. For instance, it covers long-term care (including nursing homes and home-based care) and in many states, dental and vision benefits. This broad benefit scope is a uniquely generous feature of Medicaid.
Medicaid’s exact benefits and rules vary by state. A core set of “mandatory” services are covered in all states (e.g., hospitals, physicians, nursing homes). Other benefits like prescription drugs and dental/vision are “optional,” and coverage varies across states. One key optional benefit is home-based care (called “HCBS”) for people needing support from nurses/aides to live at home. Home-based care is a key area of state variation and reform.
Federal and State Roles in Financing and Running Medicaid
Medicaid is a joint federal-state program. It is run by state-level Medicaid agencies, subject to federal rules specifying mandatory benefits, eligibility limits, and other minimum standards for quality and access. States have flexibility to go beyond these standards and provide extra benefits or quality, and to vary prices paid to medical providers. This state flexibility is intended to create “laboratories for democracy” in which states learn best practices from each other. In practice, it also creates substantial variation in per-enrollee spending across states. States change policy both through “state plan amendments” and through “waivers” approved by the federal government. The federal entity overseeing Medicaid is the Centers for Medicare and Medicaid Services (CMS), which is under the Department of Health and Human Services.
Medicaid is also jointly financed by states and the federal government. The federal government pays a standard “matching” share of costs (called FMAP) that varies from 50% to 77% (with larger FMAP for poorer states), and states pay the remaining costs. There is an enhanced federal rate of 90% for ACA expansion adults. Overall, the federal share is 65% of Medicaid costs, with states paying 35%. This setup ensures federal support, while also giving states an incentive to control Medicaid spending. However, there is regular concern that states have incentives to “game” the matching system by inflating costs to get more federal dollars. One notable example of this “gaming” is special taxes that states levy on hospitals and other medical providers. The recent OBBBA law placed new limits on these provider taxes, putting substantial stress on state budgets.
Medicaid is a major source of budget pressure at the federal and state level. The federal government, which spent about $600 billion in 2024, faces high and rising costs as medical costs rise generally – though recent cuts under the “One Big Beautiful Bill Act” (OBBBA) are expected to reduce federal spending substantially. Medicaid is a leading state budget item at $325 billion in 2024 (about 30% of state budgets).
Public and Private Roles in Medicaid
Although Medicaid is a public program, states increasingly contract benefit delivery to private managed care organizations (MCOs). 75% of enrollees are enrolled in managed care today, with substantial variation across states. Managed care’s scope has grown over time. It started by covering less complex populations (kids and adults) but has recently expanded to cover seniors, people with disabilities, and even long-term care.
Managed care’s impact: Managed care is promoted as a way to reduce spending and improve quality, but evidence on its cost and quality impacts has been mixed. In many cases, managed care firms face relatively weak cost-control incentives because of substantial risk sharing and the actuarial formulas by which managed care payments are based on past costs (a form of dynamic “cost-plus” contracting). Nonetheless, many states prefer managed care because they lack internal capacity to administer such a complex insurance program.
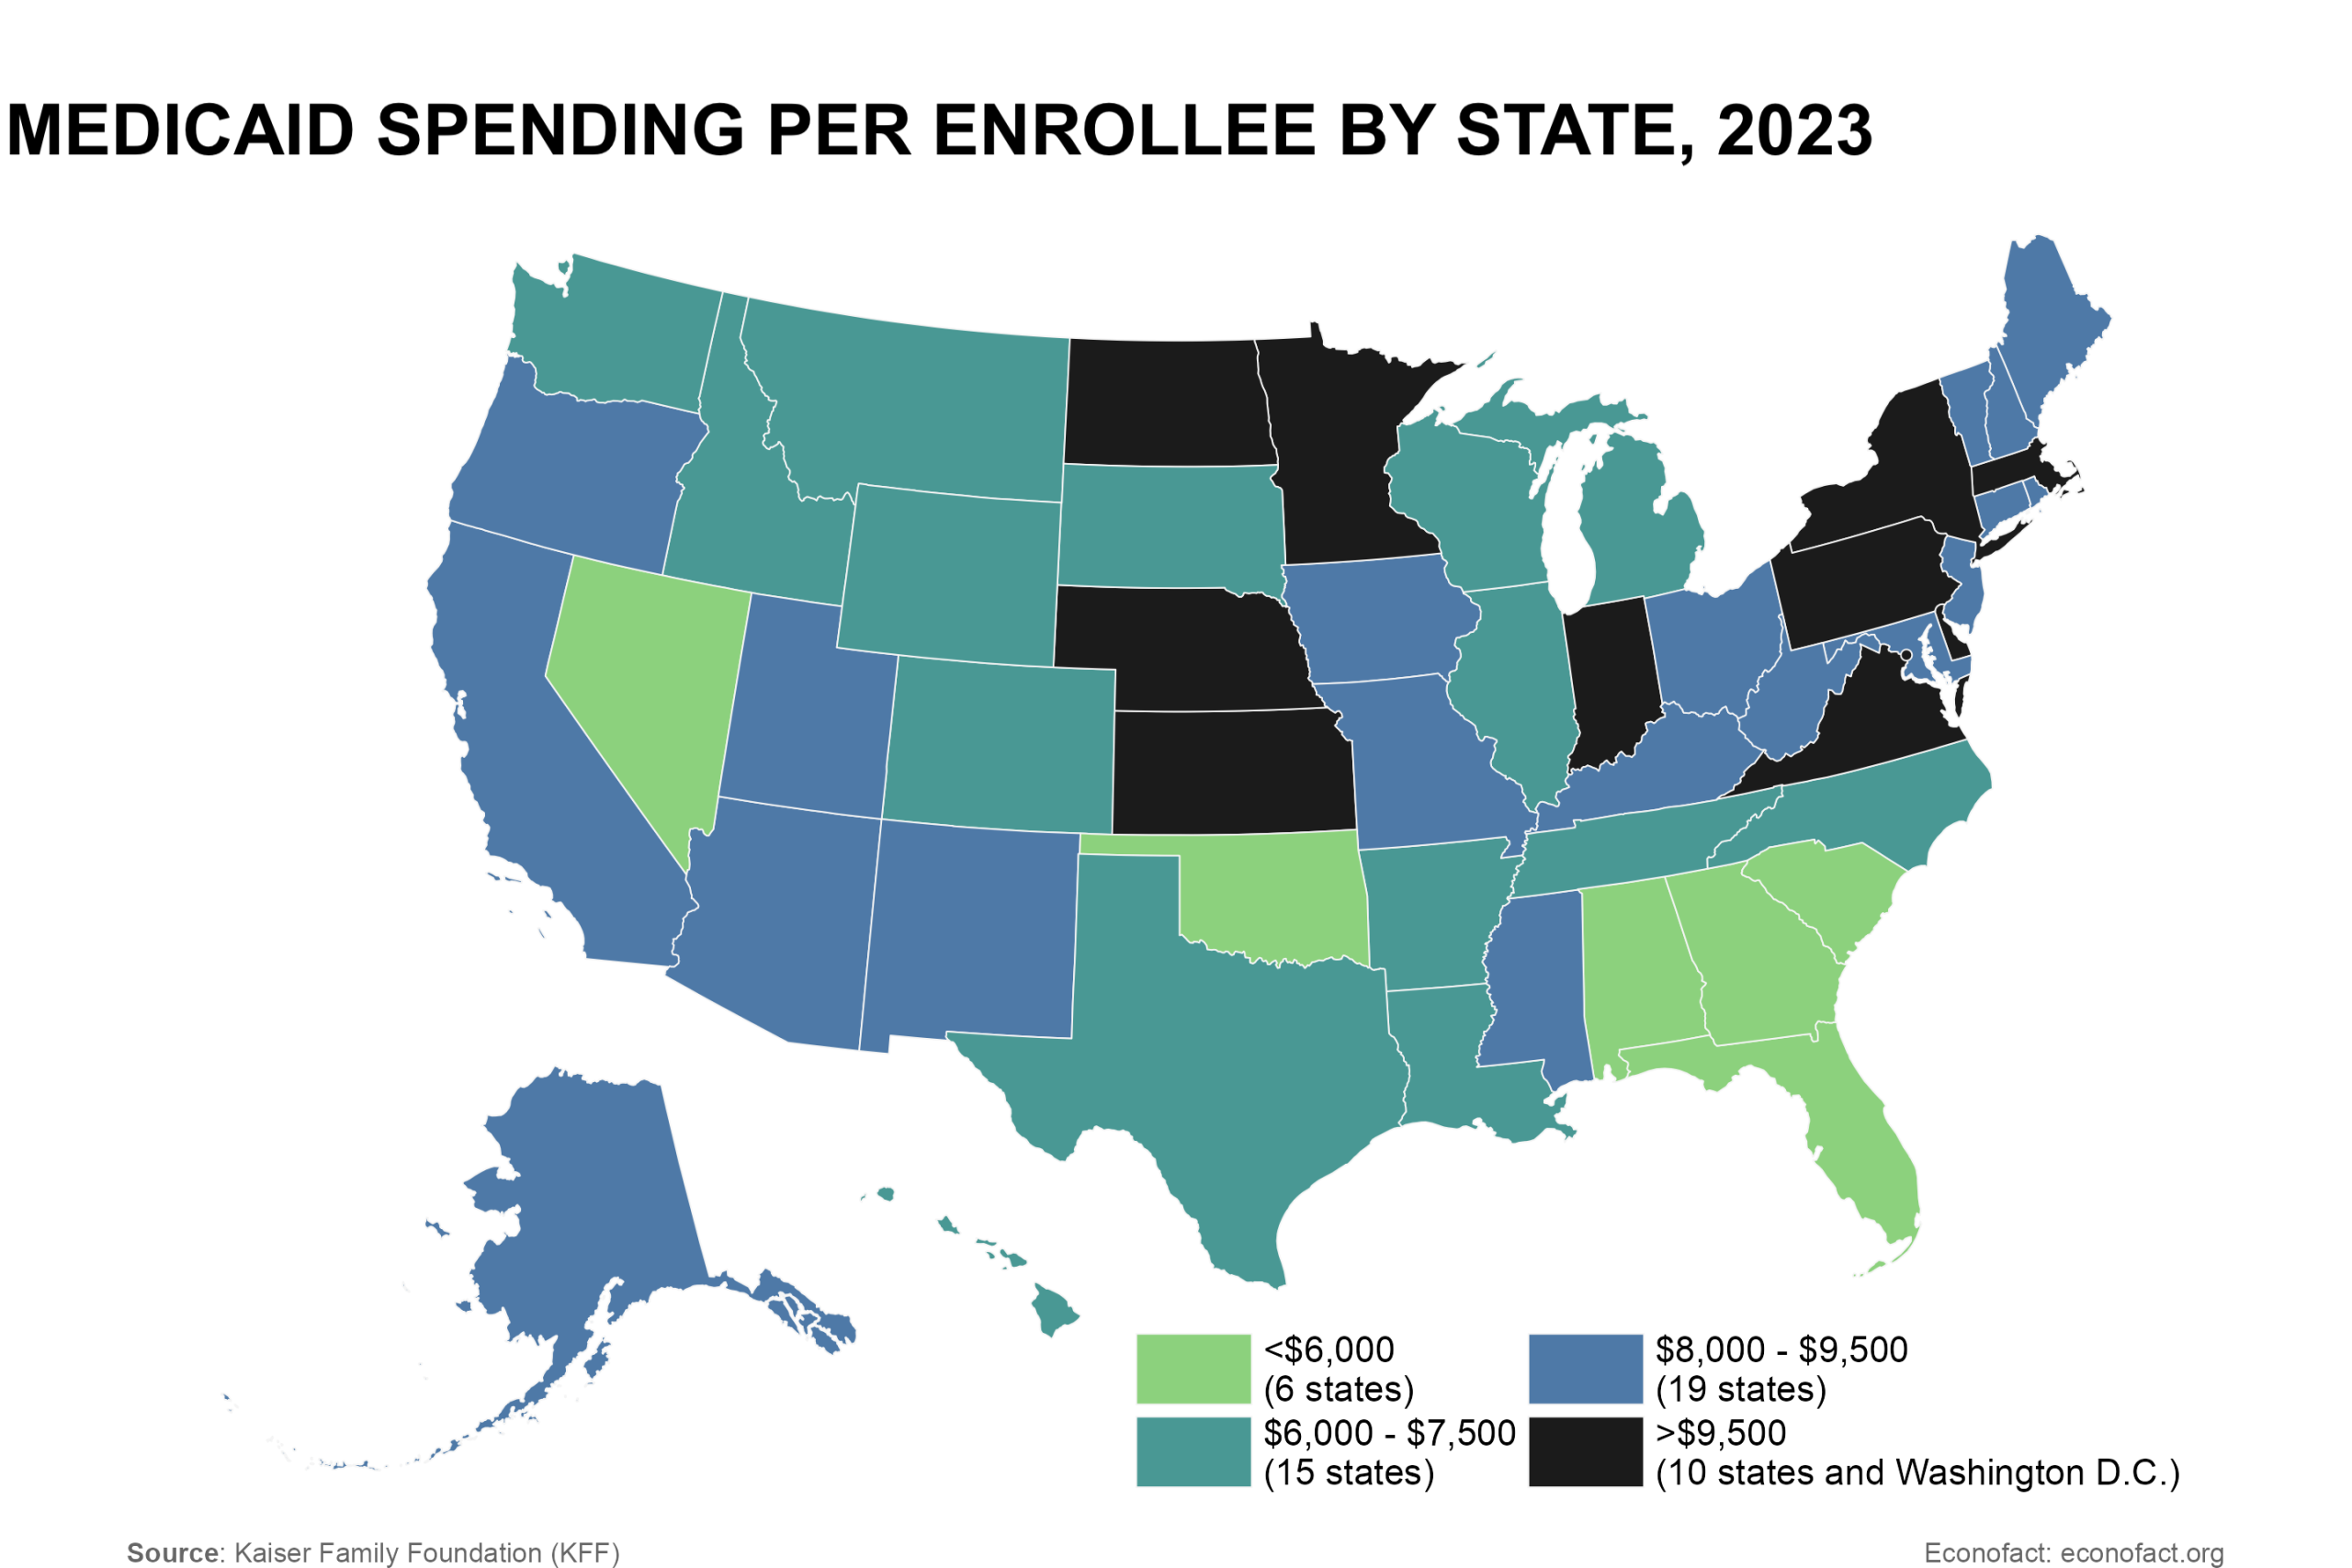
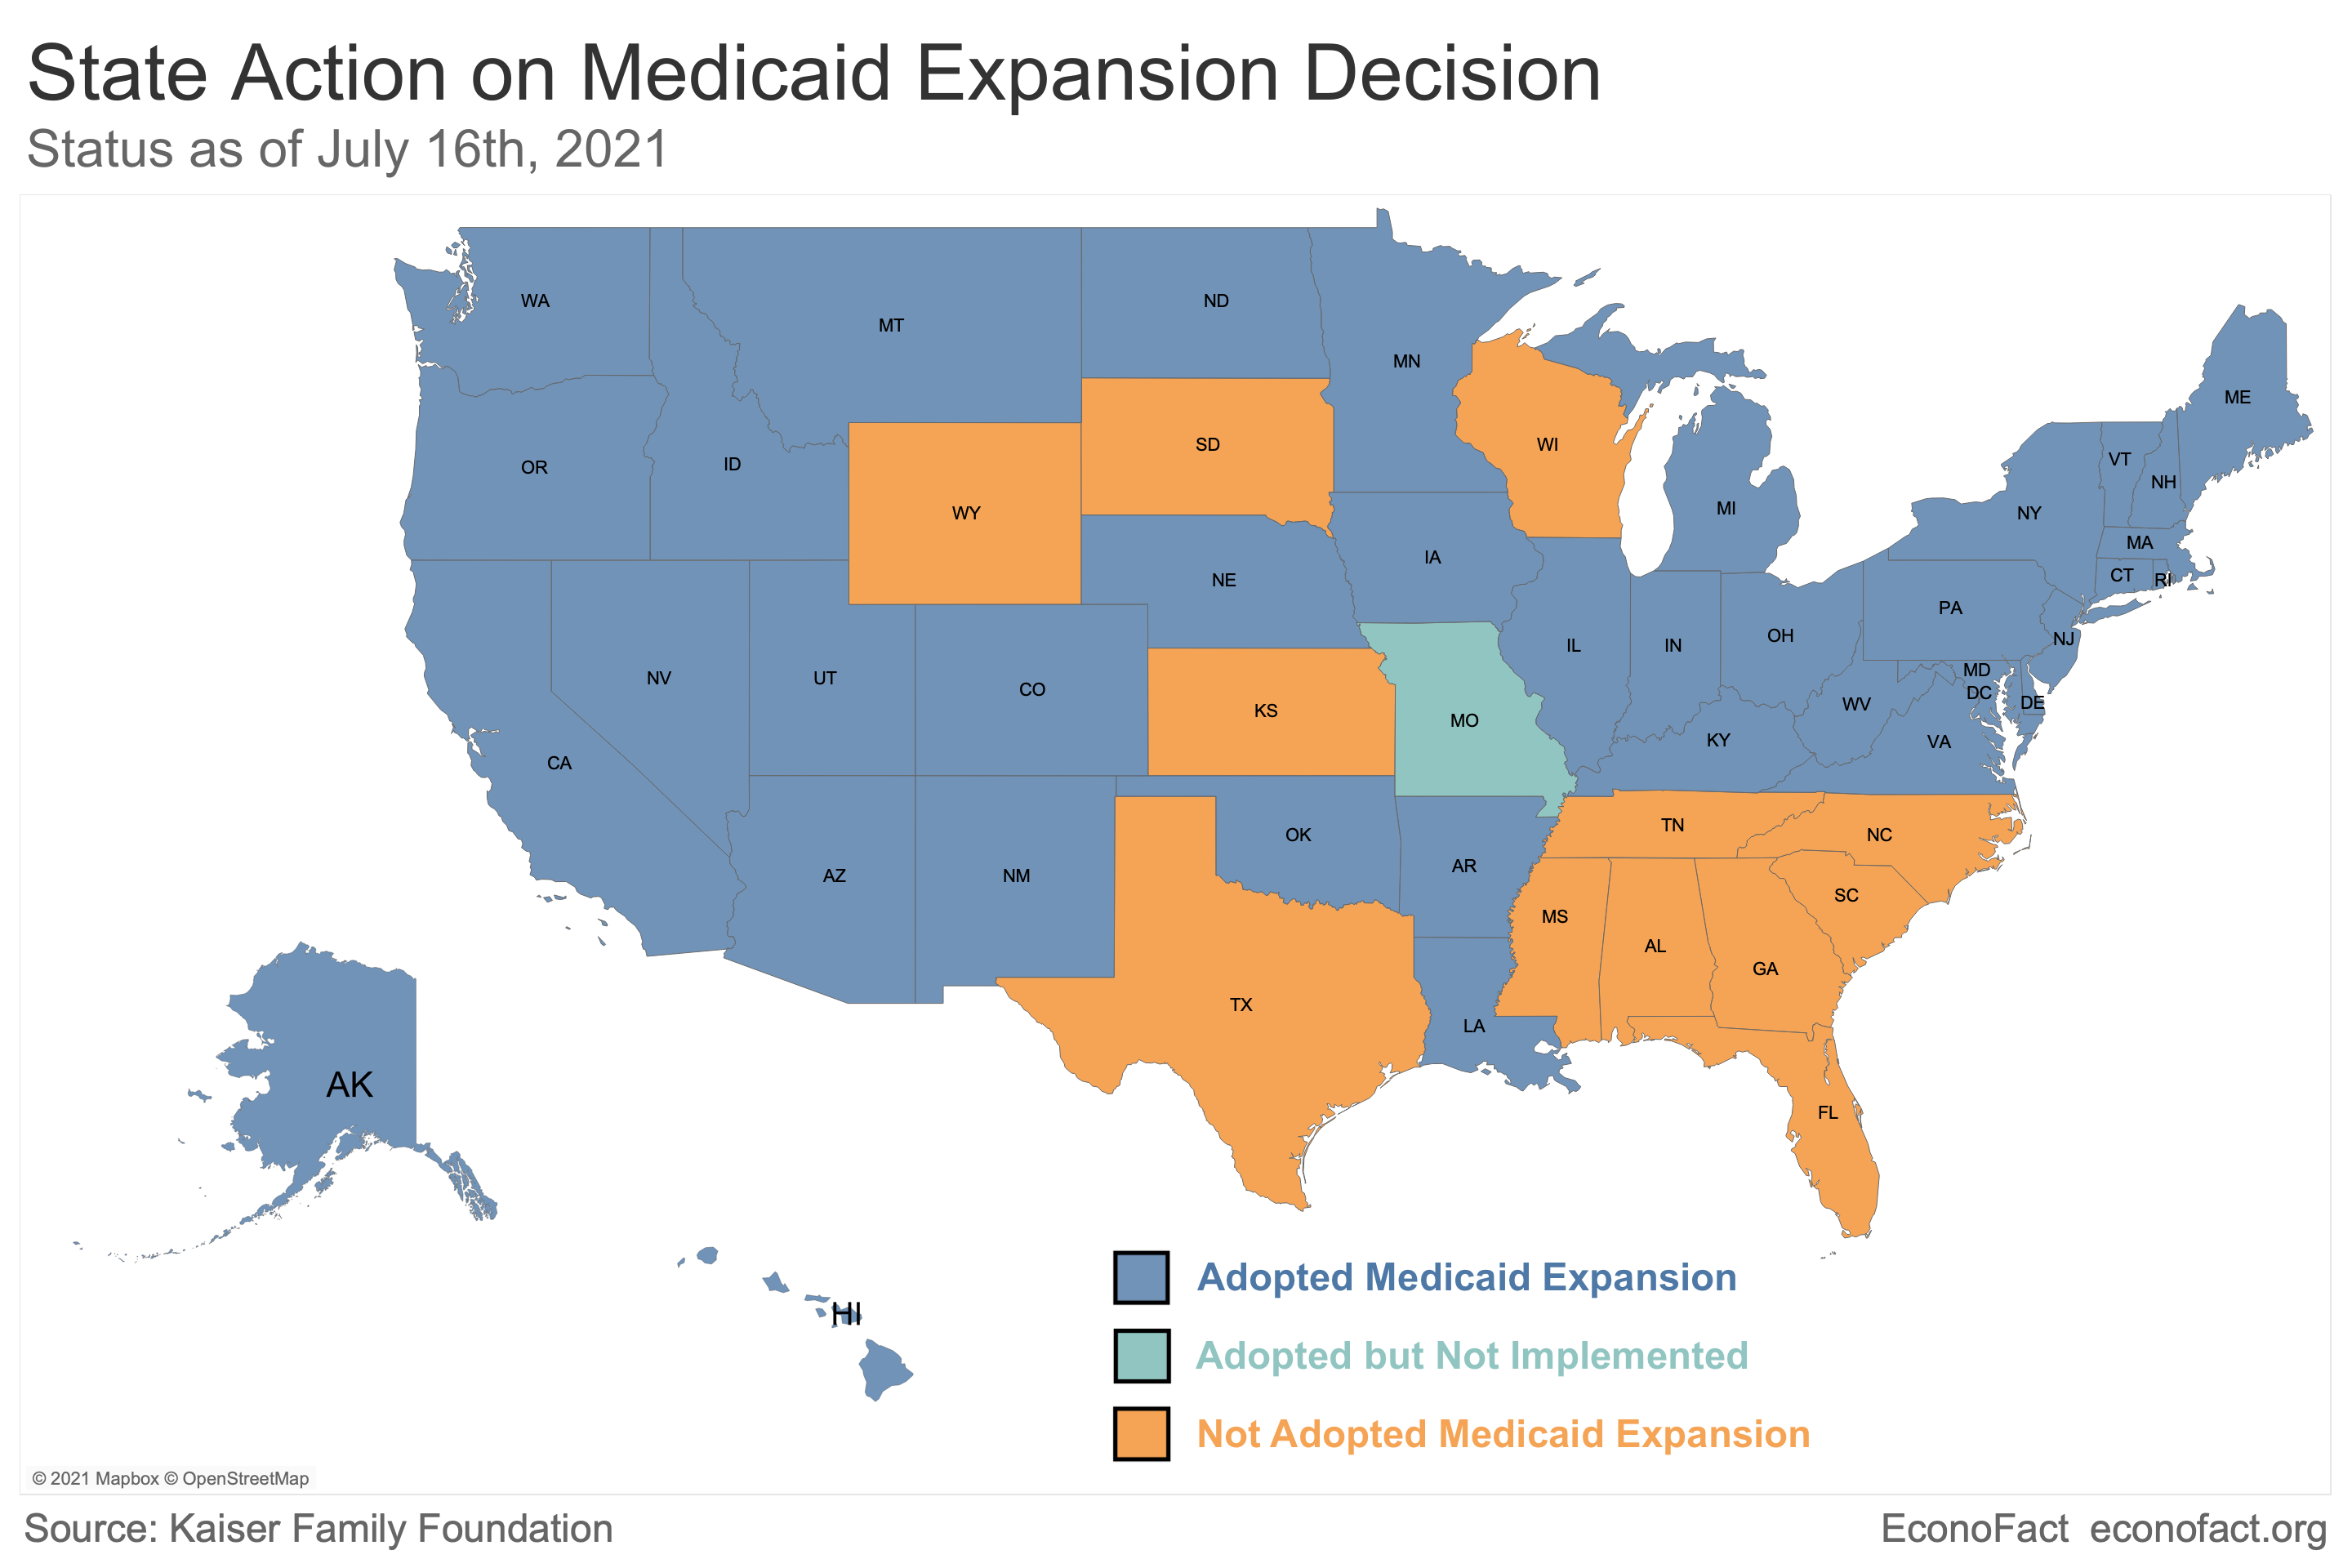
Click here for a larger version of the map.
Even when they contract to managed care, all states maintain public “fee-for-service” Medicaid payment systems. These systems pay costs for certain populations not covered by managed care and for certain “carved out” services. Overall, about 40% of Medicaid spending comes via fee-for-service payments. This dual public-private role – even for a single beneficiary – adds to the complexity of Medicaid billing.
III. Evaluating Medicaid: What do we know?
There is substantial debate about the quality and efficiency of the Medicaid program as a source of health insurance. Proponents see it as a lifeline to the poor, while critics point to its expense, complexity, and often misaligned incentives. While ultimately a value judgment involving many tradeoffs, several findings emerge from the research evaluating Medicaid:
Medicaid is superior to uninsurance. A growing body of evidence finds that people benefit from Medicaid relative to being uninsured. One of the best-known randomized studies, the Oregon Health Insurance Experiment, found that Medicaid provides financial protection, increased access to medical care, and improved mental health (though without detectable improvements in physical health). Newer studies on the ACA’s Medicaid expansion and other policy changes reinforce these results and also find that Medicaid saves lives in a cost-effective way. Evidence that Medicaid saves lives comes from several sources: (1) the introduction of Medicaid in the 1960s-70s (Goodman-Bacon 2018), (2) Medicaid expansions in the 1990s to 2000s (Sommers et al. 2017), and (3) the ACA’s Medicaid expansion, using variation in adoption across states (Miller et al. 2021, Meyer and Wyse 2025).
Medicaid has lower patient cost sharing but more limited provider choice than other health insurers. Enrollees pay zero premiums and almost no copays/deductibles for care, substantially less than in most private insurance. Medicaid also covers a broader set of services than most private health insurers, including long-term care and dental/vision care. But Medicaid has more limited provider choice: about 25% of doctors do not accept new Medicaid patients, much higher than comparable rates for private insurance (4%) and Medicare (12%). Despite limited choice, people report similar access to care in Medicaid compared to other insurance, while the uninsured report much worse access to care.
Medicaid keeps costs low by paying doctors and hospitals very low rates. Medicaid’s prices are around 20-30% below those of Medicare, which in turn pays much less than private insurers. Medicaid also pays some of the lowest prices for prescription drugs. Although low prices keep costs low, they are a key reason physicians are less willing to take Medicaid, along with Medicaid’s greater frictions with medical billing and denied claims.
Medicaid is popular, both among beneficiaries and the general public. 82% of Medicaid beneficiaries rate their health insurance as “excellent” or “good” – similar satisfaction shares as employer insurance (80%) but lower than Medicare (91%). Medicaid is viewed favorably by 83% of the general public, with strong majorities across all political affiliations.
Medicaid is a complex program for beneficiaries to navigate. Enrolling in Medicaid involves navigating a complex and confusing system for applications, verifications, and recertifications, often on clunky government application systems. As a result, Medicaid has high “churn” rates, with people regularly cycling on and off the program, and incomplete take-up among eligible people. Complexity is particularly high for seniors and disabled beneficiaries, for whom eligibility rules and program structure are more complex. In principle, simpler rules and better back-end administrative data systems could both streamline enrollment and reduce errors.
IV. Key Medicaid Policy Debates
This section gives a primer on several ongoing policy debates and reform issues in Medicaid.
The ACA’s Medicaid Expansion
The issue: The ACA (“Obamacare”) envisioned expanding Medicaid to all working-age adults with incomes up to 138% of poverty (about $22,000), but a 2012 Supreme Court decision made this expansion optional for states. As of late 2025, 40 states plus DC have expanded Medicaid, while 10 states have not. About 1.4 million individuals in these states fall into a “coverage gap”: they are uninsured but don’t qualify for Medicaid and earn too little to get ACA market subsidies (which begin at 100% of poverty).
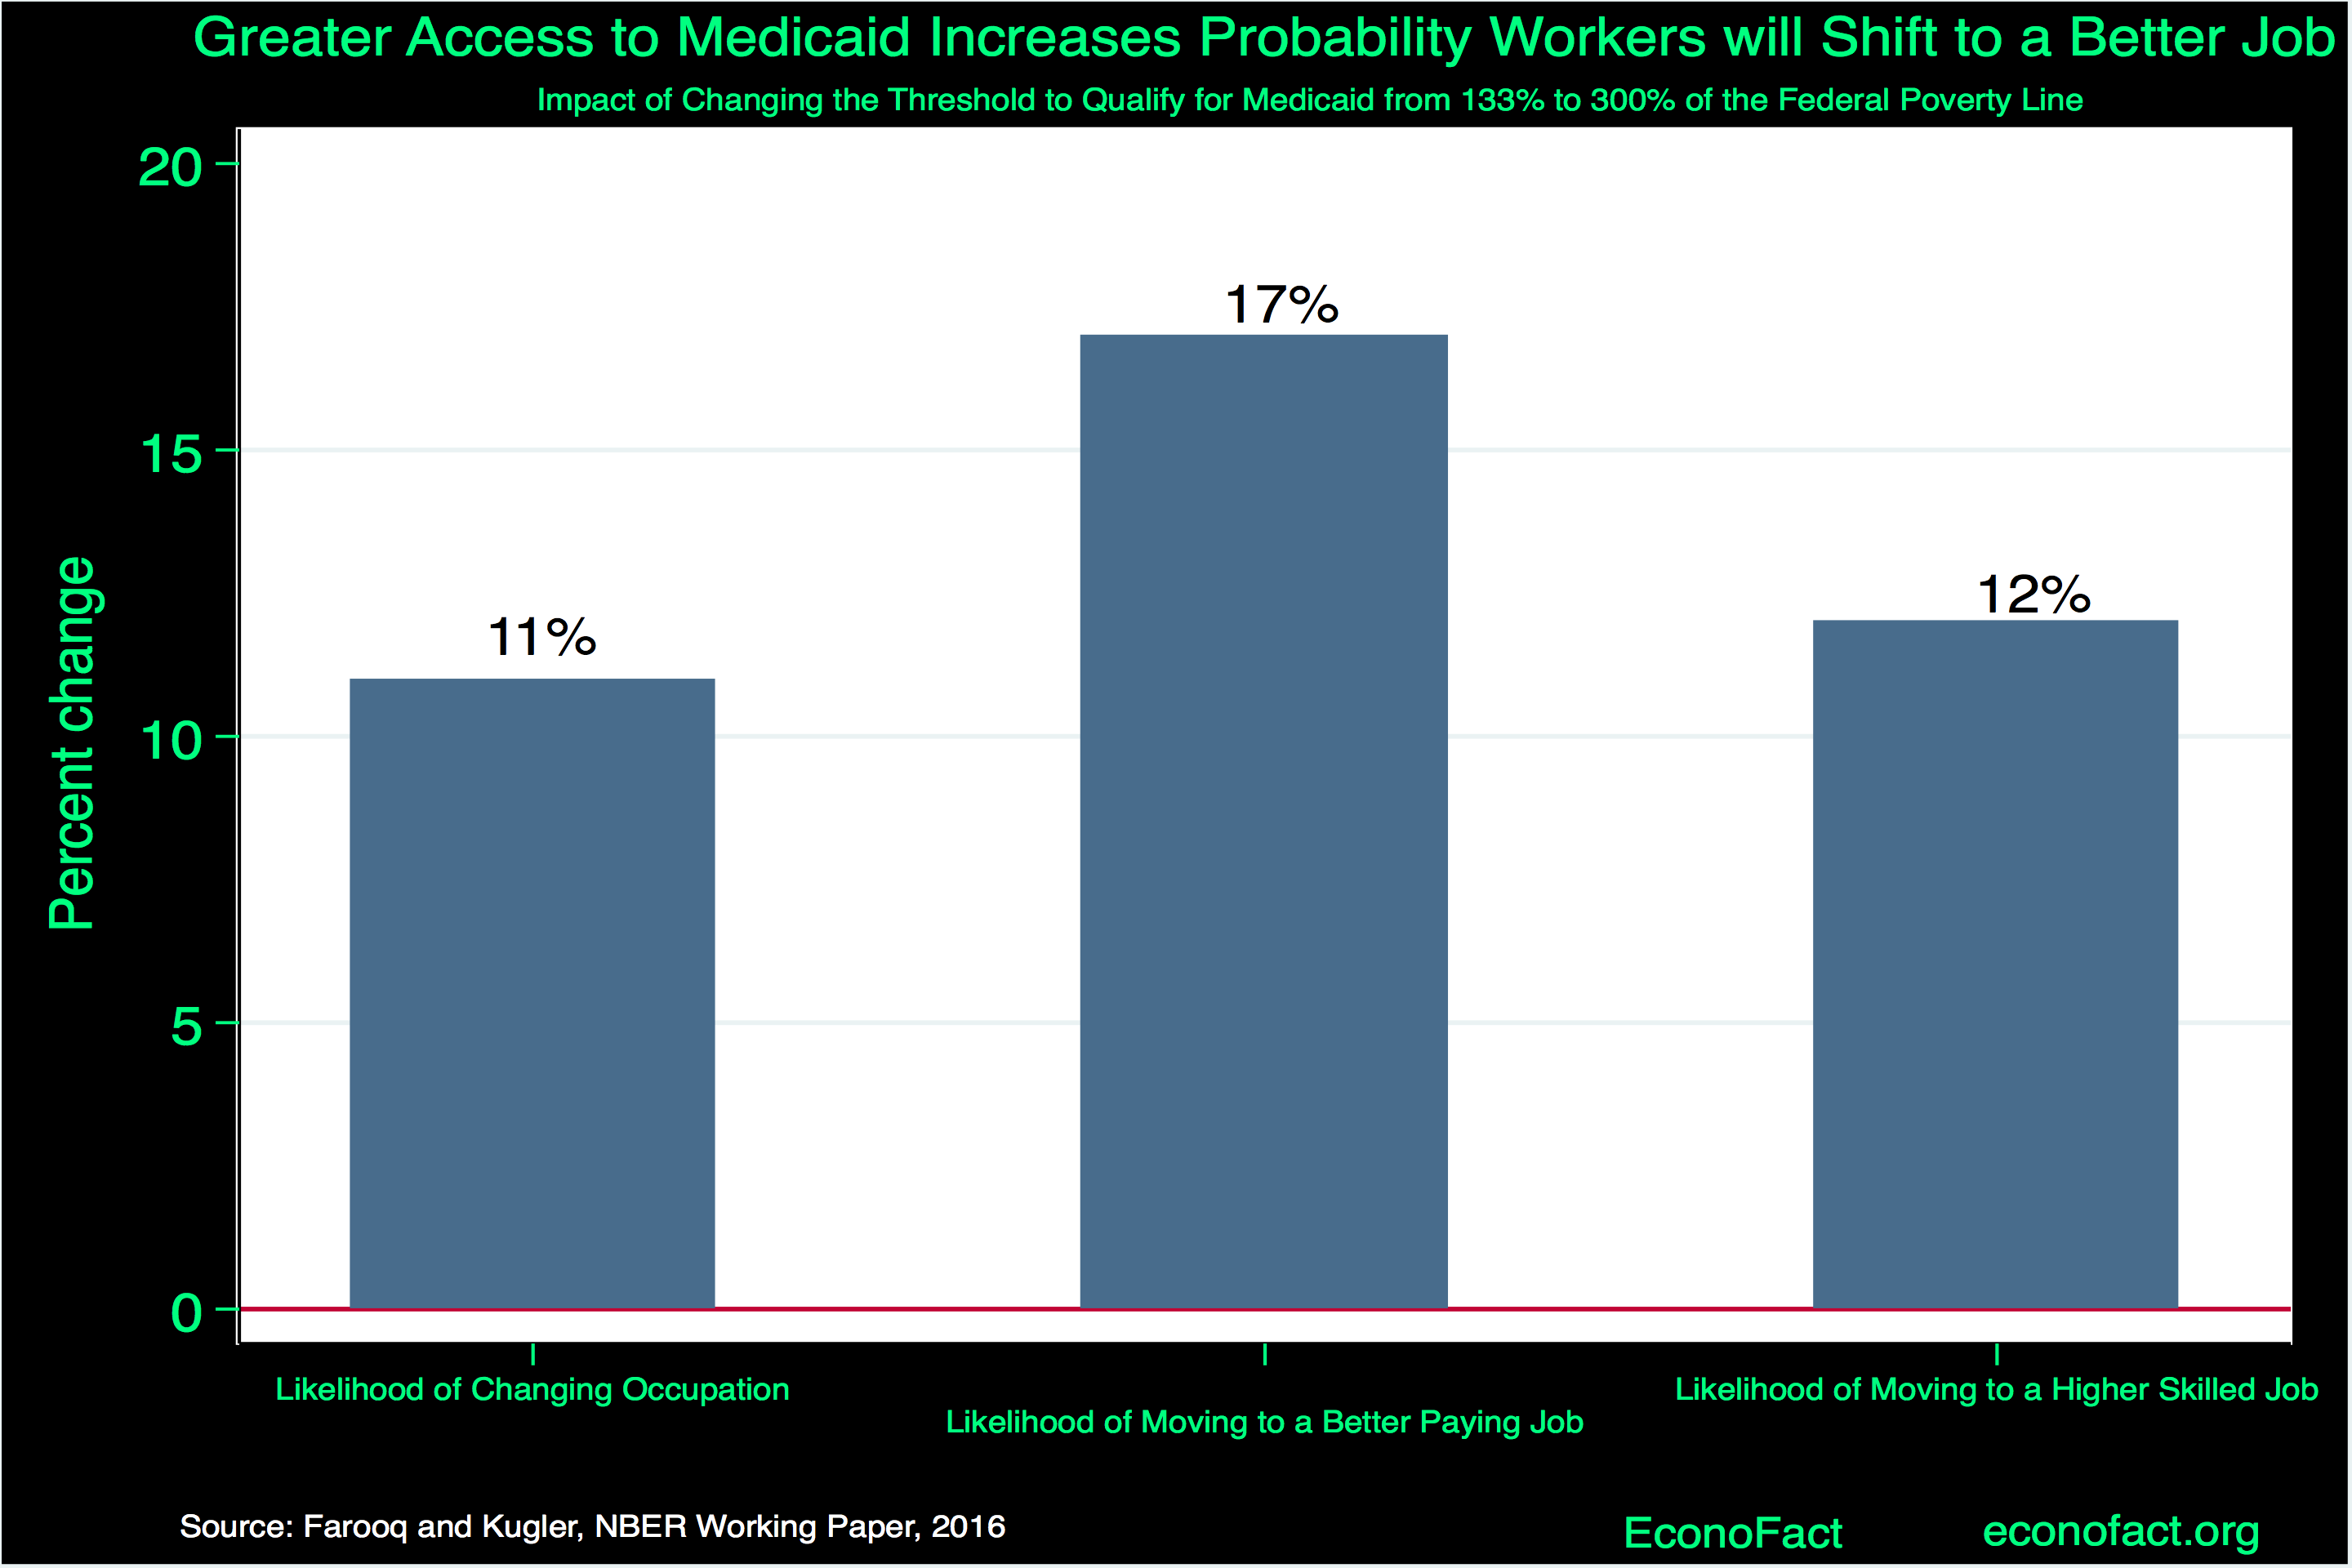
Arguments for expansion: Proponents of expansion point to evidence that the Medicaid expansion benefits people via lower financial costs, better access to care, and lower mortality (see citations above). They point out that the federal government covers 90% of the costs for the ACA expansion population, and that it saves money for local hospitals who would otherwise provide “uncompensated” care to the uninsured.
Arguments for non-expansion: Opponents point out that Medicaid was originally intended as a narrowly targeted program for vulnerable – poor kids, pregnant women, seniors, and people with disabilities. The ACA’s expansion changes the nature of the program to a broad entitlement program for the working-age poor, including many childless adults. Expansion also raises taxpayer costs for both states and (especially) the federal government.

Only 24 states plus DC adopted Medicaid expansion when the ACA started in 2014, but an additional 16 states have adopted since (with no state ever de-adopting). During President Trump’s first term, several states expanded Medicaid as part of waivers with work requirements or other incentives for healthy behaviors. With Medicaid work requirements set to take effect under OBBBA (see below), some hold-out states may consider whether to implement partial or full expansions.
Work Requirements and other Provisions in the “One Big Beautiful Bill Act” (OBBBA)
The issue: The law signed in summer 2025 enacted a host of changes expected to reduce federal Medicaid spending by about $800 billion over a decade (approximately a 10% reduction) and to result in about 7.8 million fewer people with health insurance coverage. Many of these changes take effect with a lag. OBBBA includes four key changes:
(1) Medicaid work requirements (starting in 2027): This provision requires that working-age individuals (age 19-64) must work or do qualifying activities like volunteering at least 80 hours per month to get Medicaid, unless they have an exemption (e.g., disability, parents with young kids). The goal is to encourage work and earnings among the Medicaid population. A key challenge is the complexity this adds to state Medicaid verification systems. Prior evidence from Arkansas’s 2018 work requirement found that implementation challenges led to widespread disenrollment despite 95% of people already working or having an exemption. CBO projects work requirements will raise uninsurance by 5.3 million.
(2) Increased eligibility scrutiny: States will be required to re-verify enrollee eligibility every 6 months (up from every 12 months today) starting in 2027. States will also be required to implement new provisions to verify addresses, check that deceased individuals are disenrolled, and roll back Biden-era rules seeking to ease Medicaid enrollment. These provisions are intended to prevent inappropriate and duplicate enrollment (which has been a documented challenge), but they also create significant implementation challenges for states. CBO projects these provisions will increase uninsurance by about 1.1 million.
(3) New limits for immigrants: Certain immigrant groups like asylees, refugees, and DACA recipients will no longer be eligible for Medicaid. This is expected to reduce enrollment by about 100,000 people.
(4) Limits on provider taxes and other state financing mechanisms: The law limits states’ ability to use provider taxes and other creative financing mechanisms like state-directed payments to managed care plans. These provisions have long been highlighted as a way states “game” federal matching rules to get more money, but they are also an important way states finance their programs. These provisions are expected to reduce federal Medicaid spending by over $200 billion over 10 years but force states to either increase their own spending or to find ways to cut costs.
Fraud, Waste, and Abuse in Medicaid
Fraud and abuse are perennial concerns in Medicaid. Critics point to real concerns with fraud and waste in Medicaid: incentives to game federal matching funding (e.g. through provider taxes), imperfect eligibility verification that results in unnecessary and duplicate enrollment, and high payment error rates. There are regular high-profile law enforcement actions against Medicaid fraud, including action in late 2025 against Medicaid fraud in Minnesota. Total annual fraud recoveries for Medicare and Medicaid were $3.4 billion in 2023.
But the extent of the problem (and how best to address it) are not well understood. Many analysts argue that metrics like payment error rates don’t capture fraud (instead capturing mistakes that fraudulent applicants would not make) and that the reality is more nuanced and uncertain. If not well targeted, anti-fraud policies can have unintended consequences of adding new paperwork costs on legitimate patients and providers, and new administrative costs on states. Finding ways to balance fraud prevention and administrative simplicity is a key challenge for Medicaid going forward.
Controlling Medicaid Spending
The Issue: Because of its high costs for state governments, managing Medicaid spending is a top priority. Historically, there have been three main approaches states use to control spending:
(1) Limit eligibility or enrollment: States or the federal government can limit eligibility or increase stringency for the enrollment process. This is the key approach of the OBBBA law (see above).
(2) Limit fees paid to hospitals and doctors: This is the main approach used by states historically and is a key reason Medicaid fees are so low (about 25% below Medicare, which in turn is well below private insurance) and why doctors are less likely to take Medicaid patients.
(3) Shift costs to the federal government: States enact creative financing mechanisms like provider taxes, which seek to get greater matching funds from the federal government. The OBBBA law is enacting new limits on this approach.
Additionally, states have sought to control spending by contracting delivery of Medicaid to private managed care organizations (MCOs), which now cover 75% of Medicaid beneficiaries nationally. This approach has proven popular among states, since it reduces their operational need to operate a complex insurance program. However, there is mixed and inconsistent evidence on whether shifting to managed care saves money or improves quality, relative to the alternative of state-run plans. For a recent review of the evidence, see Layton and Garthwaite (2025). For some key studies and review articles, see Duggan and Hayford (2013), Sparer (2012), Dranove, Ody, and Starc (2021), and Layton and Politzer (2025).
More creative ideas to encourage efficient delivery of Medicaid are needed. States enact a variety of trial reforms as part of various “waiver” processes that let them experiment with alternate policies. Gleaning evidence on what works from this waiver process is a key priority for researchers and policymakers.
Further reading
Kaiser Family Foundation, “Medicaid 101”
Kaiser Family Foundation, “10 Things to Know about Medicaid Managed Care”
American Enterprise Institute, “A Safety Net that Works: Medicaid”
Nina Schaefer (Heritage Foundation), “Medicaid at 55: Understanding the Design, Trends, and Reforms Needed to Improve the Health Care Safety Net”
John Igelhart and Ben Sommers (NEJM, 2015), “Medicaid at 50 — From Welfare Program to Nation’s Largest Health Insurer”
Mark Shepard, “The State of Health Insurance in America” Econfact.org