The State of Health Insurance in America
Harvard Kennedy School
The Issue:
Universal access to affordable health insurance is a longstanding U.S. policy goal and was central to the Affordable Care Act (ACA, or “Obamacare”), one of the largest social reforms of the 21st century. In the decade since it took effect in 2014, the share of Americans without health insurance has fallen sharply and now stands near an all-time low. But almost 26 million people in the United States continue to lack coverage, a far higher share than in peer nations who nearly all have universal coverage. Moreover, progress on expanding insurance coverage among the non-elderly has largely stalled since 2016. Meanwhile, economists’ understanding of health insurance has advanced considerably, with a decade of new research elucidating both the clear benefits of insurance but also its surprising tradeoffs that show the thorny challenge of getting to universal coverage within the U.S.’s current system.
The uninsured rate has been remarkably stable since 2016 despite marked changes in policy and wide availability of heavily subsidized coverage.
The Facts:
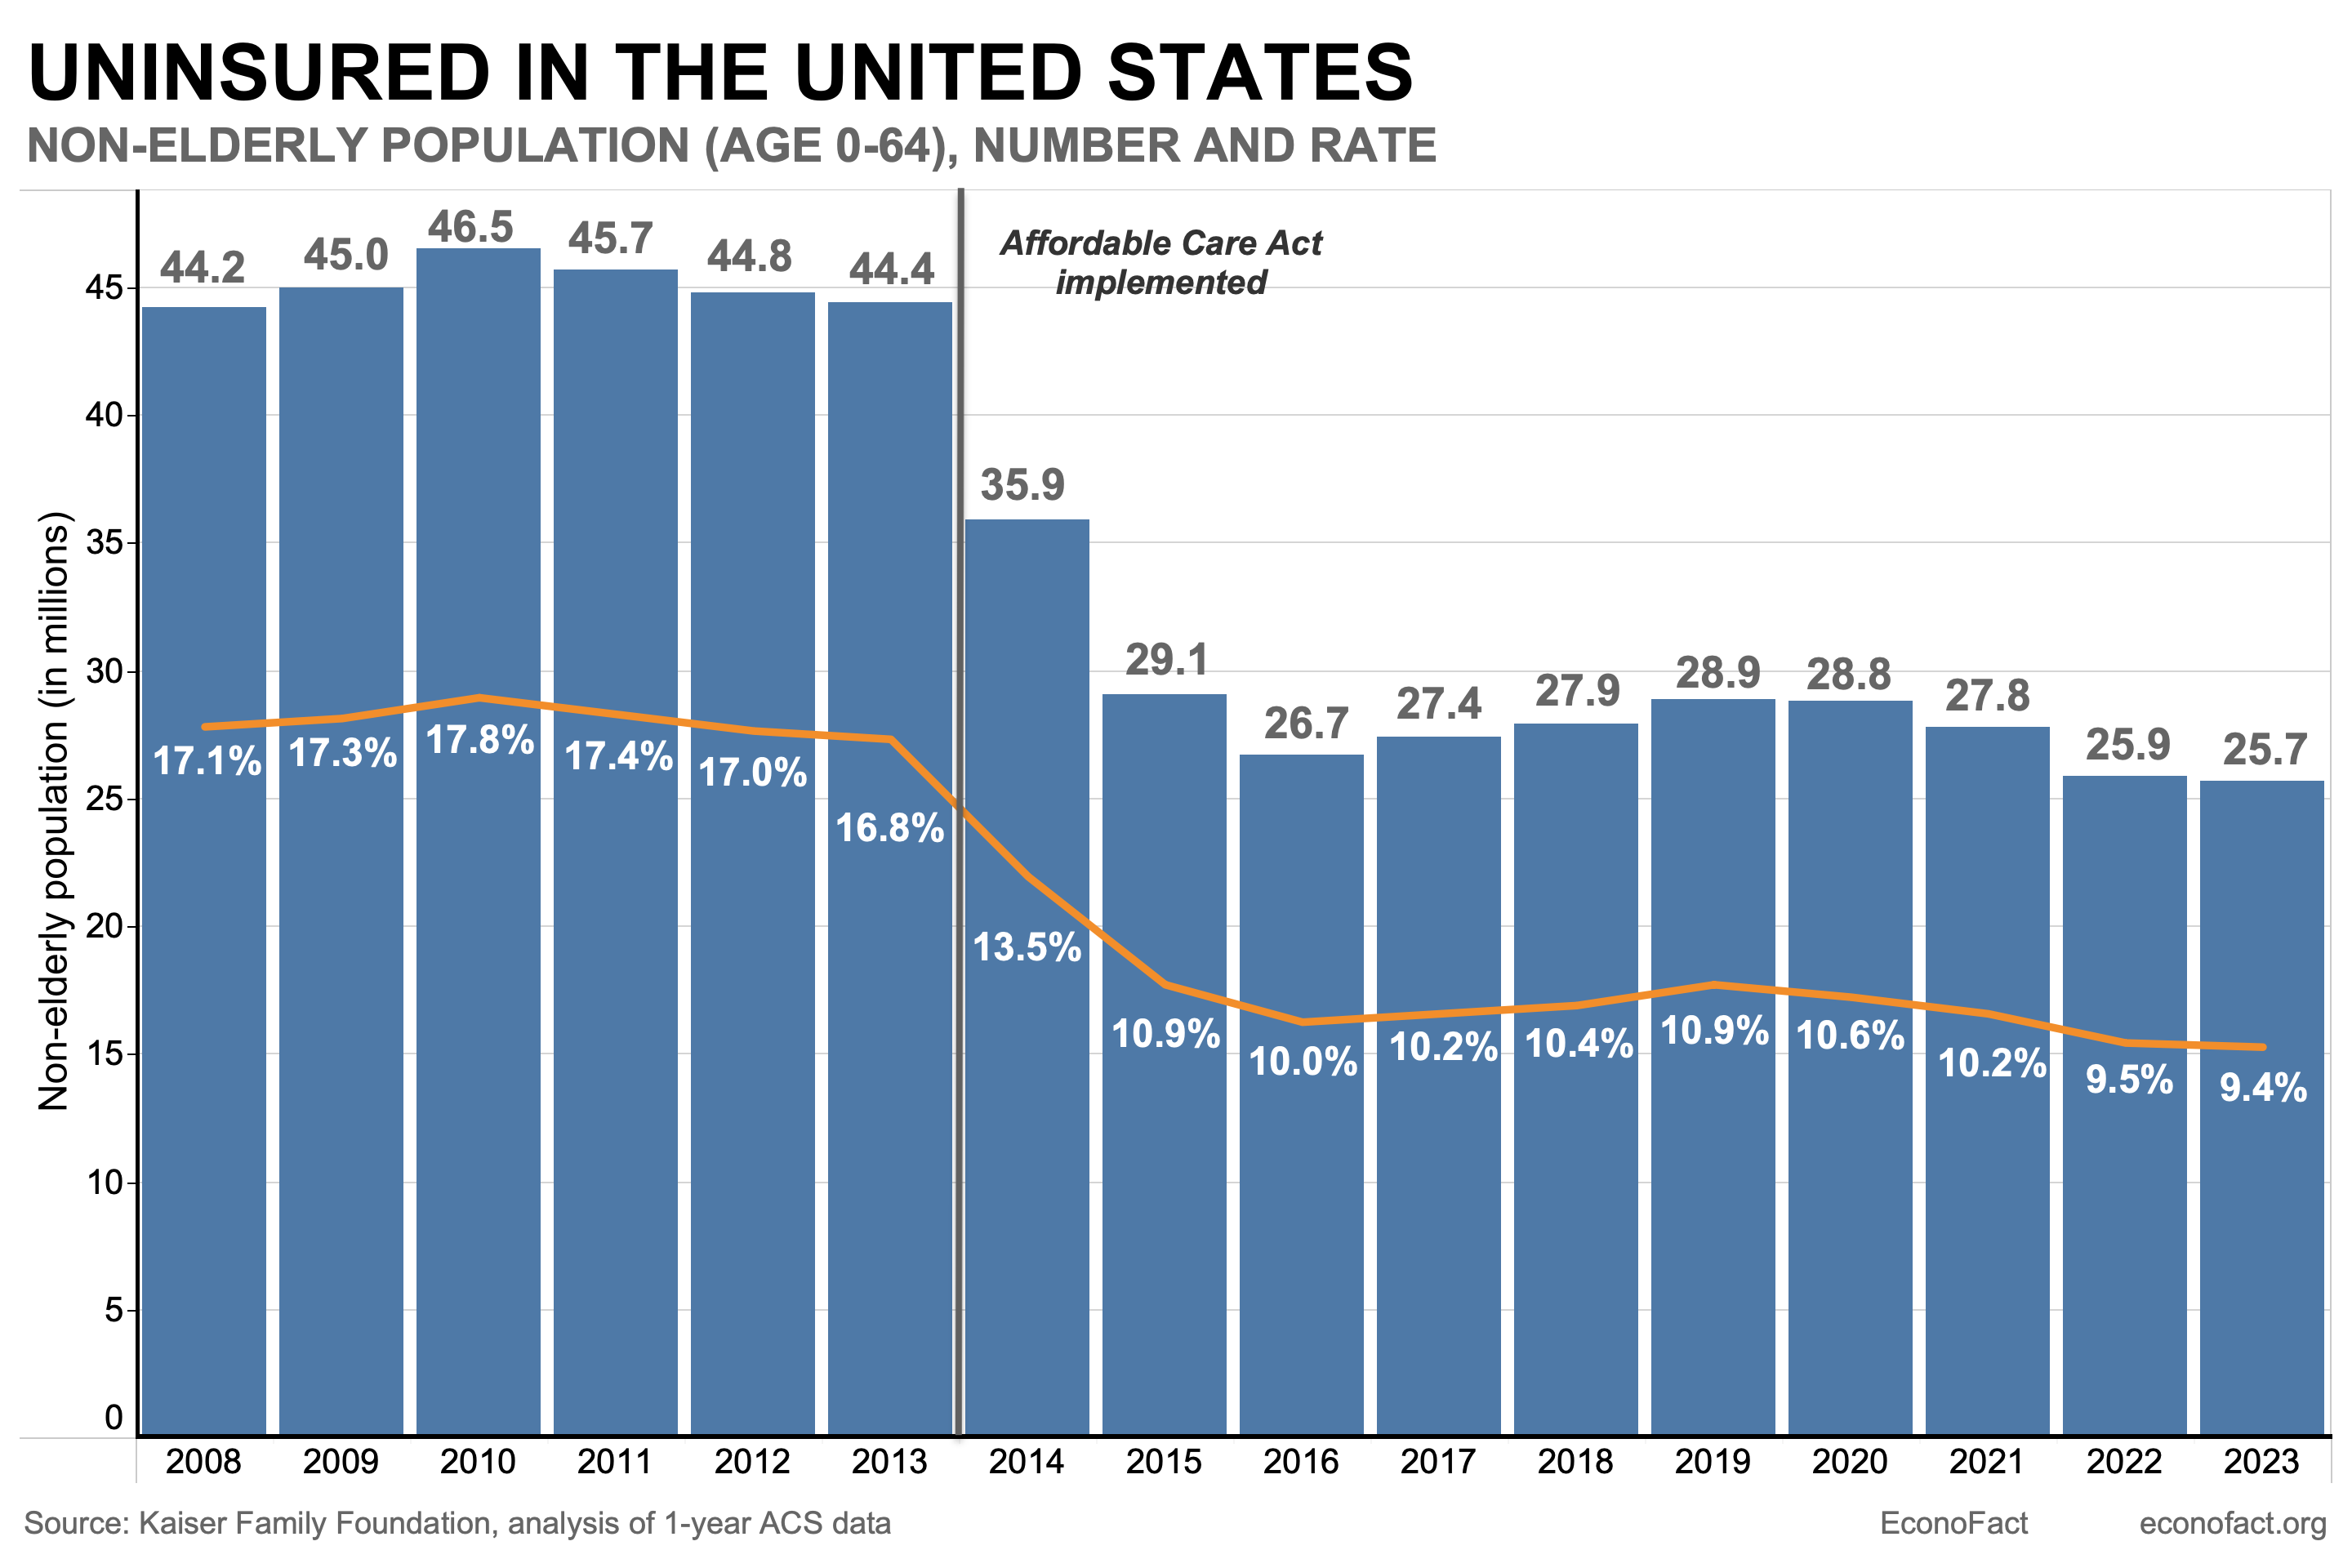
- In total, over 26 million people living in the United States lacked formal health insurance as of 2023, the latest year for which data is available. Because nearly all (99%) elderly Americans age 65+ have coverage — usually through Medicare — analysts often focus on the uninsured rate among those aged 0-64. The non-elderly uninsured rate was 9.4% in 2023, or 25.7 million people (see chart).
- The uninsured in America are more likely to be lower-income and members of racial minorities. In 2023, 23.6% of Hispanic adults aged 19 to 64 were uninsured — about double the rate for Black adults (11.1%) and much higher than the rates for non-Hispanic White adults (7.0%), and for Asian adults (6.8%), according to the latest Census figures. Children under the age of 19 have additional coverage options, including access to the Children’s Health Insurance Program (CHIP). For this reason, uninsured rates for children tend to be lower than for working-age adults, though differences by race and ethnicity persist. The highest uninsured rates are for noncitizens (32.9%), who are often poorer and ineligible for subsidized public programs (Census, Figure 5). Non-elderly uninsured rates vary substantially by state, from a low of 3% in Massachusetts to a high of 18.7% in Texas, according to data from the American Community Survey. While partly due to demographic differences in the population composition of the states, this variation also comes from several states’ decisions not to expand Medicaid to low-income families, as allowed by the Affordable Care Act. Among these “non-expansion” states, 32.5% of poor families are uninsured vs. 18.7% in expansion states (see Figure 6).
- The Affordable Care Act (ACA), better known as “Obamacare,” sought to give all Americans access to affordable health insurance. The U.S. does not have universal health coverage but rather a patchwork system of both private and public providers (see here). Over 50% of Americans receive health coverage through employment-based private health insurance. Since not everyone is eligible to receive health insurance through their jobs, the ACA sought to increase access to health insurance with a three-pronged strategy. First, it expanded eligibility for Medicaid — the country’s public health insurance for low-income Americans — to those with incomes up to 138% of the federal poverty level. Second, it created new subsidies for private insurance to make private coverage more affordable for middle-income people (100-400% of poverty). Finally, it required people to obtain health insurance or pay a tax penalty — what was known as the “individual mandate” and which was repealed as of 2019.
- The number and share of Americans without health insurance fell sharply after the enactment of Obamacare’s main coverage provisions in 2014 but then reached a plateau. In 2013, 44 million non-elderly Americans lacked coverage (a 16.8% rate), and that had fallen by one-third to 26.7 million (10.0%) by 2016 (see chart). Researchers have studied the extent to which the different provisions of the ACA contributed to lowering the share of Americans lacking health insurance. The 2012 Supreme Court decision that allowed states the option not to expand Medicaid made it possible for researchers to compare outcomes in states that expanded Medicaid against those that did not. Using this natural experiment, a huge number of studies find strong evidence that Medicaid expansion reduces uninsurance. Other work finds evidence that larger subsidies also increase private insurance take-up and reduce uninsurance. Finally, there is good evidence that the “individual mandate” tax penalty increased coverage, but that the effect was more modest than anticipated.
- Since 2016, the uninsured rate has been largely steady, despite swings in policy. The uninsured rate rose slightly from 2016-2019 as the Trump administration weakened certain ACA provisions – for instance, cutting funding for enrollment assistance and zeroing out the tax penalty on uninsurance as of 2019. However, a 2017 attempt to “repeal and replace” the ACA itself narrowly failed, with the late Sen. John McCain casting a dramatic late-night “no” vote to decide the outcome. Despite the pandemic and associated economic upheaval, the uninsured rate fell from 2020-2023 – a departure from the usual pattern of rising uninsurance during recessions. A major reason for this were policy changes enacted in response to the pandemic, particularly the expanded generosity of insurance subsidies starting in 2021 and the suspension of regular Medicaid beneficiary eligibility redeterminations that was in place until 2023. There have been shifts in the source of coverage. Since the provision to suspend Medicaid redeterminations expired in 2023, more than 25 million people have exited Medicaid. At the same time, there has been a sharp growth in ACA insurance marketplace enrollment (which as of 2024 cover 21 million people, almost double the enrollment in 2021).
- There is robust evidence that expanding health insurance coverage in the U.S. saves lives and protects people from financial risk. The past decade has seen substantial research adding to economists’ understanding of the causal effects of health insurance coverage, especially for the poor. New research, including from a large randomized experiment and the ACA’s Medicaid expansions, finds that expanding health insurance coverage significantly reduces mortality. These results are in line with the findings from earlier studies using variation in state policies and the 1960s-70s introduction of Medicaid. For non-mortality outcomes, the Oregon Health Insurance Experiment found large improvements in mental health but no impacts on physical health. There was already good evidence that insurance protected people from financial risk, and these findings have been confirmed by evidence from the Oregon Experiment and the ACA Medicaid expansions.
- Increasing coverage leads to higher medical care use and costs. New evidence confirms classic findings that people incur higher medical spending across the board when insured, a phenomenon called “moral hazard.” Consistent with this, the share of GDP spent on health care jumped noticeably around the ACA’s enactment (from 16.9% of GDP in 2013 to 17.6% of GDP in 2016). There is growing debate about how much of this additional spending is wasteful vs. valuable care that the uninsured could not previously afford.
- Most of the remaining uninsured (about 60%, or 15 million people) appear to qualify for either free or subsidized insurance via the ACA, and about 40% likely qualify for completely free coverage. Despite this, the main reason cited for uninsurance (by two-thirds of the uninsured) is that “coverage is not affordable.” This suggests that non-price barriers to coverage – like lack of knowledge and the hassles and burden of enrolling in public programs –are the key remaining barrier to coverage expansions, as highlighted by several recent research papers.
What this Means:
Despite large and rapid gains in insurance coverage following the implementation of the Affordable Care Act in 2014, about 26 million people remain without health insurance in the United States. The experience from the past decade illustrates the difficult challenge of getting to universal coverage within a complex and voluntary health insurance system. The uninsured rate has remained remarkably stable since 2016 despite marked changes in policy and despite wide availability of heavily subsidized coverage. But the stakes are high. Research from the previous decade has solidified evidence that expanding health care coverage reduces mortality and protects people from financial risk — even if it comes at a cost. If policymakers wish to get meaningful further coverage gains, the evidence suggests reducing non-price barriers to getting insurance, like information and enrollment hassles, is essential.
Like what you’re reading? Subscribe to EconoFact Premium for exclusive additional content, and invitations to Q&A’s with leading economists.