How Should We Think About 2020 GDP Growth?
Fletcher School, Tufts University and George Washington University
The Issue:
No matter how you measure it, there is no doubt that the collapse of Gross Domestic Product (GDP) in the Spring of 2020 was the most precipitous on record. But there are different ways of reporting change in the value of economic activity, which can lead to some confusion. The reported magnitude of the contraction can vary greatly depending on the measure used — and this is particularly the case when the change in the pace of economic activity is large and happens rapidly, as occurred at the start of the COVID-19 pandemic.
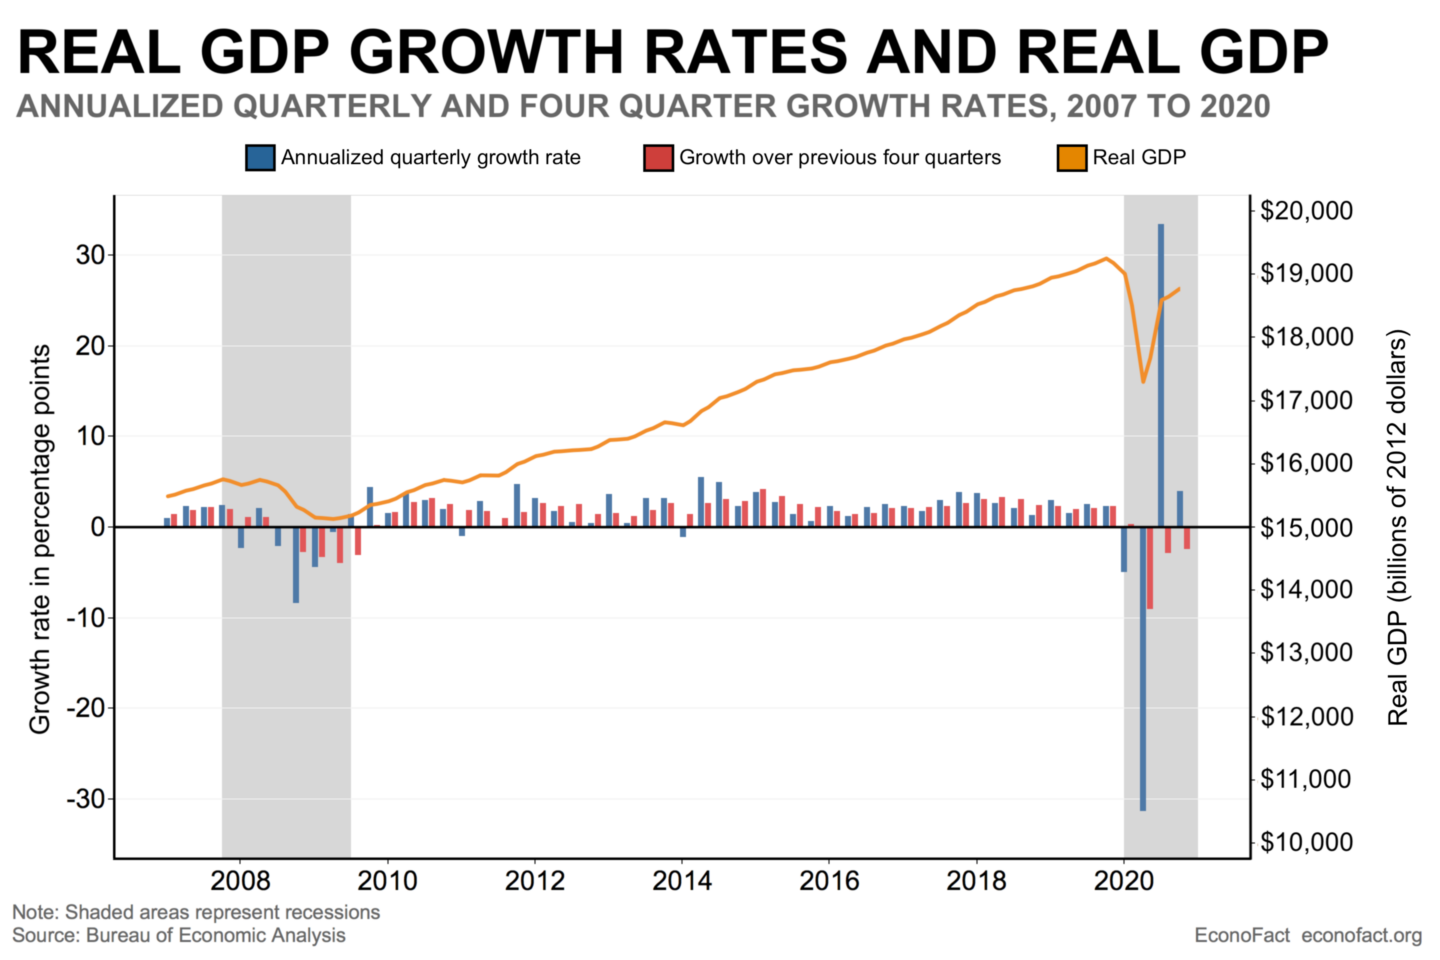
Annualized quarterly GDP growth rates swung dramatically in 2020. But GDP was lower at the end of 2020 than it was at the start of the year.
The Facts:
- Real GDP growth — the change in the value of goods and services produced by the U.S. economy (net of any changes in prices) — is typically reported every quarter in an annualized version. The quarterly headline growth announcement by the Bureau of Economic Analysis takes the quarter-to-quarter change in economic activity and reports what would happen to GDP if growth continued at that pace for a full year. The annualization of the quarter-to-quarter change presents very large values in 2020. The Bureau of Economic Analysis reported a decline of Real GDP of 31.4 percent at an annual rate in the second quarter of that year. The headline figure in the third quarter was of an even larger magnitude, but in the opposite direction: a positive growth rate of 33 percent (at an annualized rate). The actual change in GDP (not annualized) in the second quarter itself was a decrease of 9.0% while GDP rebounded by 7.5% in the third quarter.
- The swings in economic performance are not as dramatic when using alternative calculations and, in fact, offer statistics that are not only smaller but, for the final two quarters of 2020, show negative, rather than positive, growth. The growth of national income can also be calculated by comparing GDP to its value one year before. Comparing the level of GDP in any quarter of a year to its level in that quarter of the previous year smooths out temporary swings in GDP and also corrects for any errors associated with differences in GDP due to the time of year (e.g. higher GDP during the Christmas season) that were not corrected by seasonal adjustment. Comparing GDP in the fourth quarter of 2020 to its value in the fourth quarter of 2019 (Q4/Q4 growth) gives a growth rate of -2.5% for 2020. Similarly, the growth rates of the other three quarters of 2020, calculated by comparing GDP to its value one year before, were 0.3% for Q1/Q1, -9.0% for Q2/Q2 and -2.8% for Q3/Q3. These growth rates, while smaller than annualized quarterly changes, are very large in the context of this type of calculation (see the chart.) There were only 6 quarters between 1947 and 2019 when annual growth rates calculated this way were less than -2.5%, and the largest decline of these was -3.9% (in the second quarter of 2009) - so this measure also shows the unprecedented contraction in the economy in 2020.
- GDP was lower at the end of 2020 than at the beginning of the year. The -2.5% growth rate between the fourth quarter of 2020 and the fourth quarter of 2019 reflects the fact that GDP was $18.8 trillion at the end of December versus $19.2 trillion at the beginning of January (all in 2012 dollar terms.) In fact, GDP at the end of 2020 was lower than any value in 2019 or in the second half of 2018. While the 33.4% and 4.0% annualized quarter-to-quarter growth rates in the second half of 2020 were greater than the rates of decline -5% and -31.4% in the first two quarters, GDP had fallen so much by the middle of the year that GDP began the second half of the year from a small enough value that these growth rates did not result in the economy catching up to its beginning-of-year value. While one’s first impression may be that a 33.4% annualized growth rate overcomes the effect of a -31.4% prior annualized growth rate, in fact these consecutive growth rates result in a reduction of GDP of 2.1%. To illustrate this point, if you start with $100 and lose 50% of your money, you have $50. If you then make a 50% gain, you will have only $75. Resetting the baseline of the economy to a lower level means we need faster growth to recover to prior levels.
- A third way to calculate GDP growth is to compare the average values of GDP for one year to the average in the previous year. This is known as annual average or Year-to-Year (Y/Y) GDP growth. International organizations like the International Monetary Fund (IMF) and the World Bank calculate country-level GDP growth and GDP growth for the world as a whole using this method. (This is the only feasible method when, as is the case with many countries, GDP is only reported on an annual basis.) This can yield a very different result than the Q4/Q4 measure. For example, the Year-to-Year Real GDP growth rate from 2019 to 2020 was -3.5%, which is a full percentage point larger (in absolute value) than the Q4/Q4 decline. The reason for the discrepancy is that the large dip in GDP in the second quarter does not figure into the calculation comparing the end-of-2020 GDP to the end-of-2019 GDP, but it does affect the average GDP in 2020 as compared to the average GDP in 2019. Likewise, Y/Y GDP growth in 2021 is likely to be bigger than Q4/Q4 growth in this year because the Q4/Q4 growth will measure the difference in GDP between the final quarters in each year while the Y/Y GDP growth will factor in the very low values of GDP in the second quarter of 2020.
What this Means:
The discrepancies across these three ways of calculating GDP growth do not reflect incorrect mathematics or the distortion of statistics; it is simply a reflection that these methods can yield different results. The different statistics are useful for different purposes. Annualized quarterly growth gives a snapshot of the pace of the economy using a scale that is familiar to people. The simple quarterly growth rate tells how much the economy actually changed in a quarter (and may be more useful at extreme turning points). Growth over four quarters helps give the general pace of the economy and shows how it changes in a given year. Year over year annual rates can be helpful to compare across countries with data limitations. But because of their different calculation processes, looking at the economy over time using these methods gives different results. Differences across these measures are especially stark when the economy goes through sudden, sharp changes in GDP.
Like what you’re reading? Subscribe to EconoFact Premium for exclusive additional content, and invitations to Q&A’s with leading economists.