What Would We Lose if We Stop Tracking Food Insecurity?
McCourt School of Public Policy, Georgetown University
The Issue:
As of 2023, the latest data available, an estimated 47.4 million people in the United States lived in households that experienced times during the year during which they were uncertain of having — or unable to acquire — enough food to meet the needs of all their members. Whether this situation improves or worsens will become difficult to ascertain. The U.S. Department of Agriculture recently announced that after 30 years, it will no longer conduct the annual Food Security Survey which provides widely used data on food insecurity and other factors. In its press release, it characterizes the survey as creating “redundant, costly, politicized, and extraneous studies do nothing more than fear monger. For 30 years, this study … failed to present anything more than subjective, liberal fodder.”
Not collecting food insecurity data will make it harder to monitor the economic well-being of lower-income Americans as safety net programs are cut and food prices rise.
The Facts:
- Food insecurity measures whether a household has consistent access to adequate resources to obtain the food they need. A household’s food insecurity status is based on their answers to a series of 18 questions ranging from the least severe (how often the household worried whether their food would run out before they had money to buy more) to the most severe (whether a child went for a day without eating because there wasn’t enough money for food). Although some have criticized food insecurity as a “jargon” term that could be replaced by a more intuitive term such as “hunger,” food insecurity actually measures a broader concept. Some people experiencing food insecurity also experience what we would call hunger, but not everyone does. For instance, households that experience food insecurity in some cases can cope by relying on a few basic foods and reducing variety in their diets. Research finds that food insecurity affects dietary quantity and quality. The survey allows researchers to differentiate ranges of food security by the level of difficulty households encounter in meeting their food needs. At the most severe range, “very low food security,” a family’s eating patterns have been disrupted and food intake reduced because of lack of resources to purchase food.
- The national USDA survey is the only comprehensive source that allows us to monitor food security consistently over time and has the statistical power to zoom in on particular groups such as rural populations, families with children and older Americans. The survey is collected annually from approximately 40,000 households and can be used to produce estimates that are representative at both the national and state level. It makes use of other federal data infrastructure to minimize the survey cost and maximize the information garnered: The survey has been collected as a special supplement to the December Current Population Survey (CPS), which is the primary source of labor force statistics for the population of the United States. Food insecurity can only be assessed using survey questions, and there is no comparable source of information from administrative data. Some questions have an aspect of subjectivity to them — one person’s threshold for reporting being “worried” about running out of food can be different from another’s. But others do not, such as whether any child had to skip a meal because there wasn't enough money for food. The National Academies of Sciences, Engineering and Medicine conducted an assessment of the methodology used in the food insecurity measure in 2006.
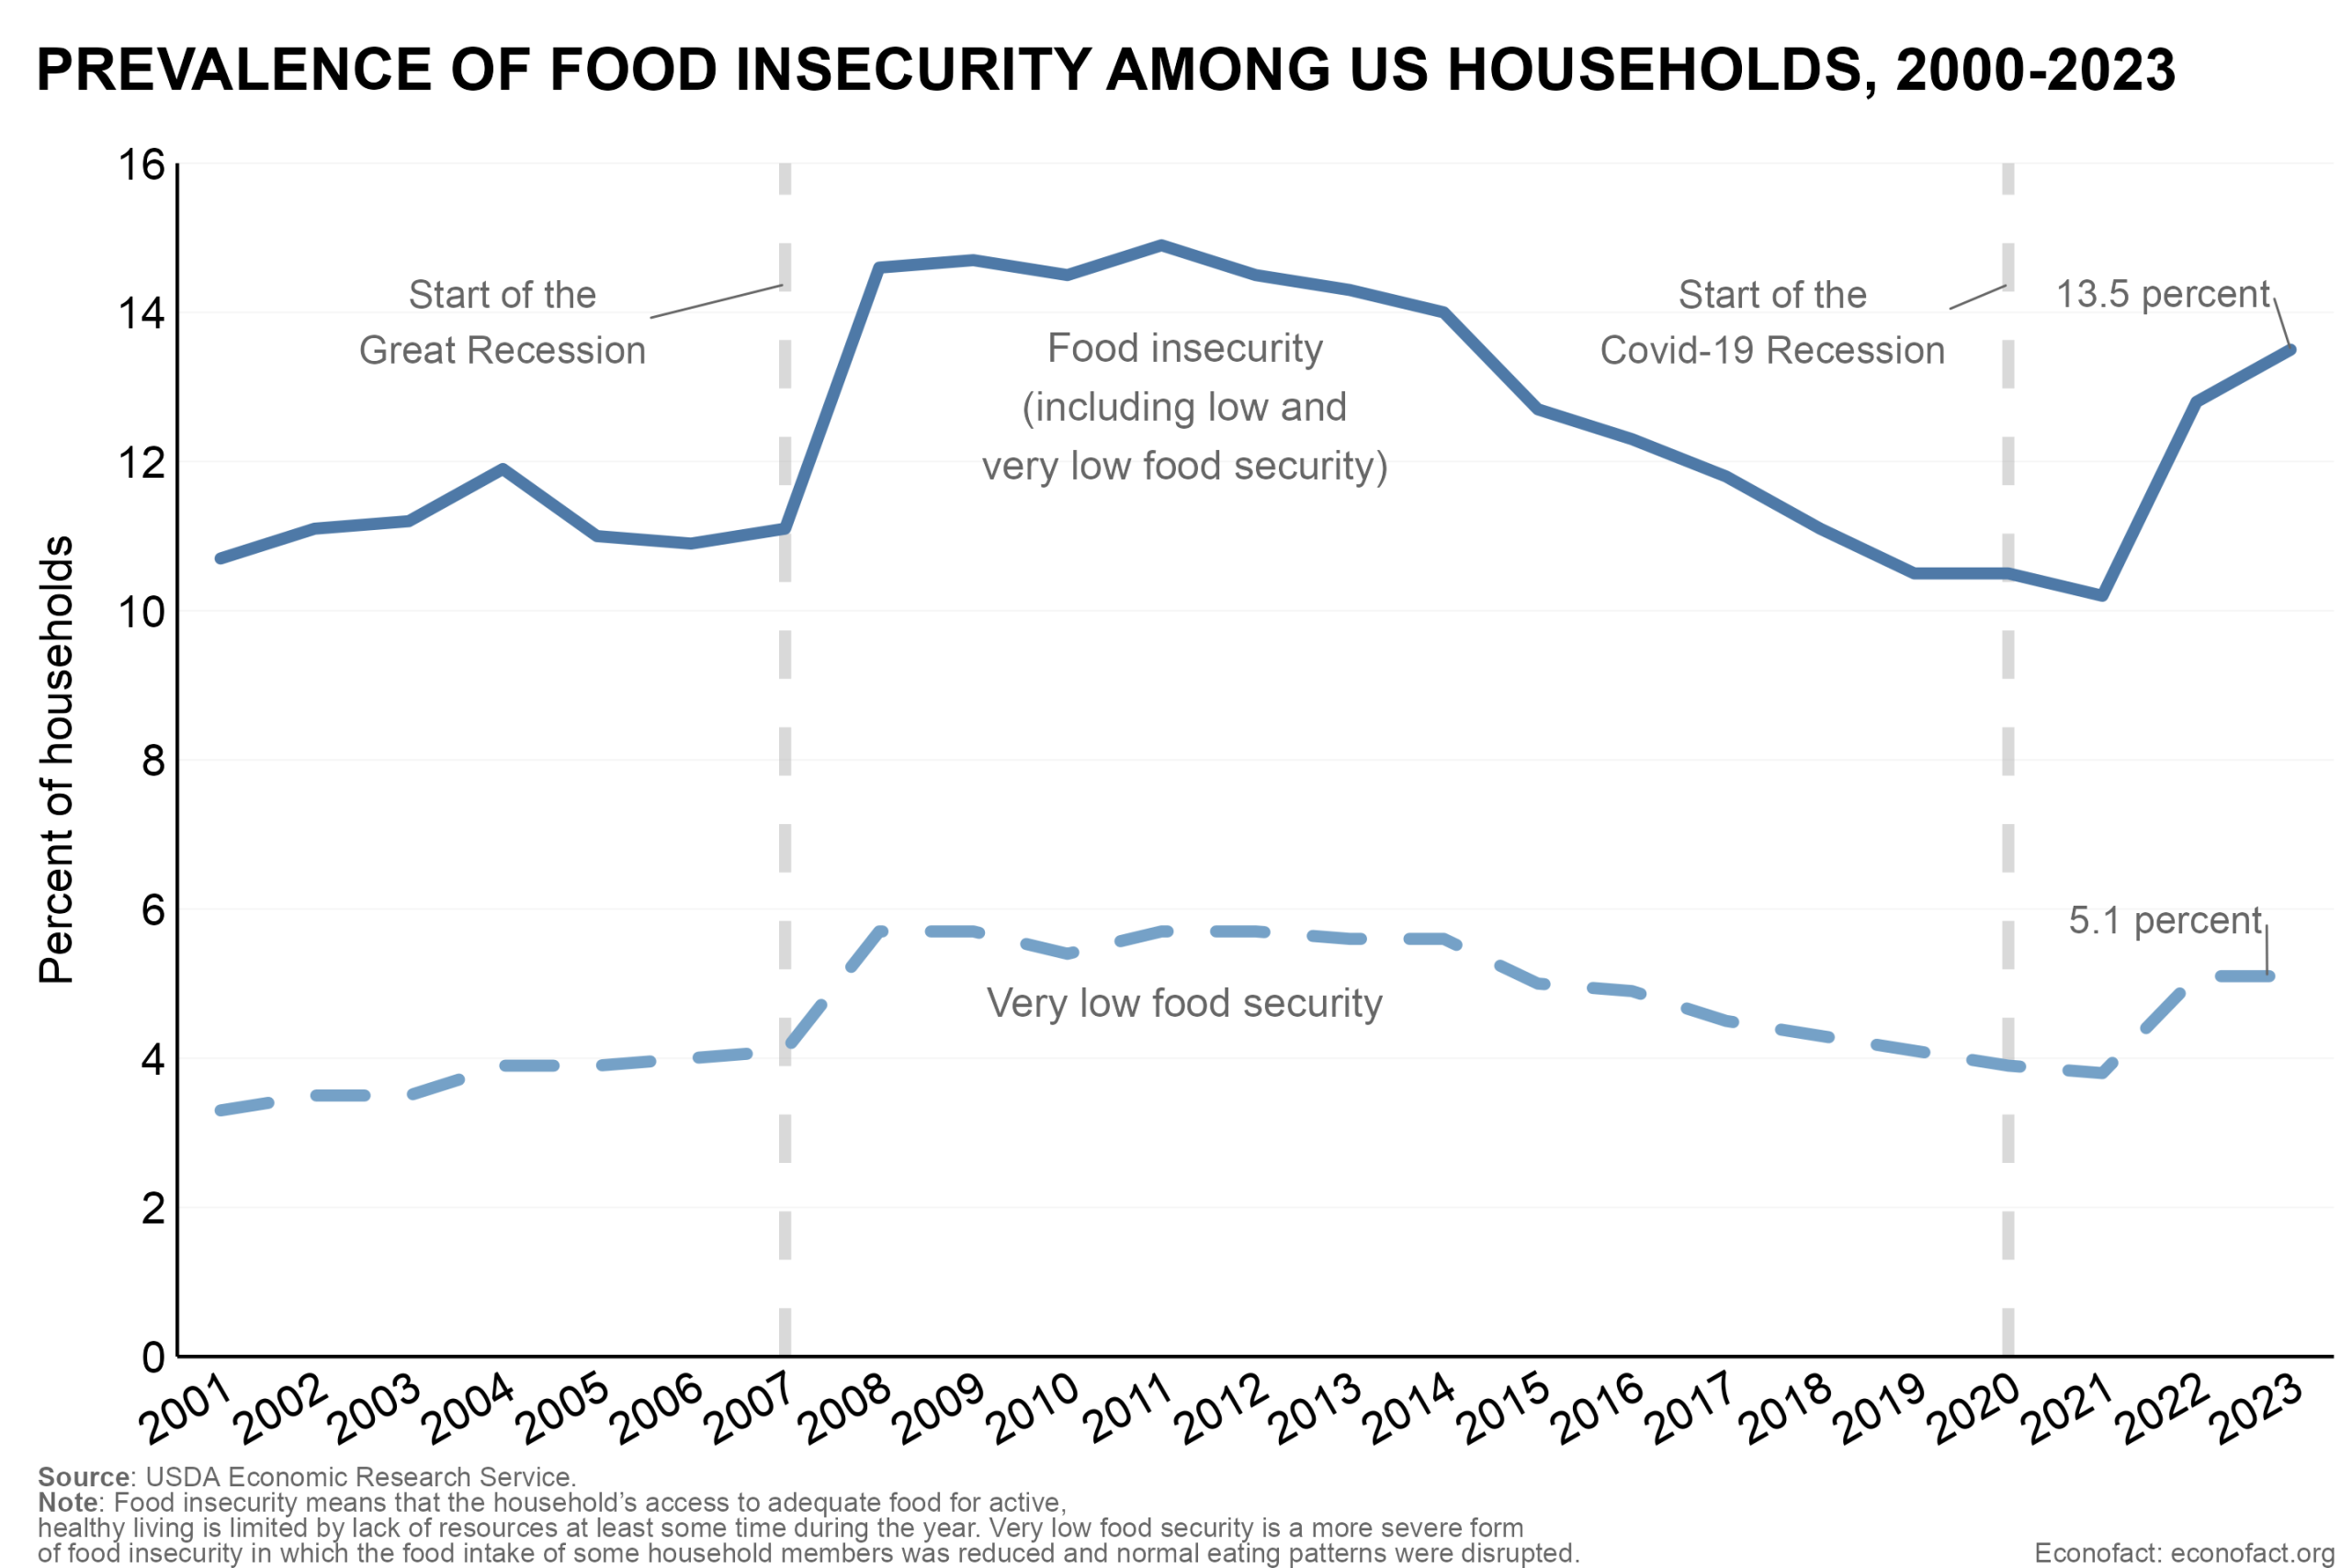
- An estimated 13.5 percent of U.S. households (18 million households) were food insecure at some time during 2023. Of these, 6.8 million households experienced very low food security. Food insecurity tends to be higher than the national average among households with children under 18 — 6.5 million households or 17.9% of households with children were insecure at some point in 2023. Single parent households, women living alone, and Black and Hispanic households also tend to experience higher rates of food insecurity than the national average (see here).
- While there is a relationship between food insecurity and income, food insecurity captures a different dimension of economic well-being. The likelihood that a household reports being food insecure declines steadily as household income increases, but there is not a one-to-one mapping between the measures. Even among the lowest-income households, the majority of respondents indicate that they have not experienced food insecurity. Moreover, about one-third of households that experience food insecurity have annual incomes above two times the poverty threshold. For many of them, especially households living paycheck to paycheck, food insecurity could be a temporary experience in a month with unusually high expenses such as medical bills or car repairs that squeeze their food budgets. Food insecurity is also sensitive to the timing of income. Poverty rates are measured based on a household’s total annual income, which can mask economic hardship that occurs within the course of a year. For example, if a household starts the year unemployed they may experience food insecurity, but after they obtain steady employment their annual incomes may be above the poverty threshold — making them both food insecure and not in poverty in the same year. This sensitivity to the timing of resources is a useful advantage of the measure. For example, we saw that food insecurity rates increased before other economic markers began to indicate rising economic distress during the Great Recession because it was quicker to pick up the squeeze in families’ budgets. In addition, food insecurity can better capture when households have inconsistent access to resources, such as when people live paycheck to paycheck but work seasonally.
- What influences food insecurity rates? Research has found that food insecurity rates rise and fall with economic changes and policy interventions. It rose sharply in 2008 during the Great Recession, peaking at 14.9 percent of households in 2009 (see chart). Food insecurity declined slowly even as economic conditions improved, because low-income families typically experience more severe levels of hardship during recessions and take longer to recover (as is the case with unemployment rates). During COVID-19, food insecurity fell in response to the range of relief payments made, including the fully refundable Child Tax Credit, increases in SNAP benefits, Pandemic EBT payments that compensated families for missed free school meals, and summer EBT benefits. The share of households facing food insecurity rose again in 2022 and 2023 as pandemic benefits began to be phased out and the U.S. experienced rapid food inflation. Overall, the share of families experiencing “very low food security” is substantially lower than the share experiencing food insecurity and is less volatile over time.
- Measuring food insecurity in a reliable and consistent way makes it possible to set goals to improve the population’s economic well-being, target resources and evaluate the effectiveness of social assistance programs. Food Banks use measures and predictions of food insecurity to forecast need levels and to identify geographic areas that need additional assistance. Food insecurity has been used as an outcome to evaluate the effectiveness of government programs. For example, a pilot program to provide transportation assistance to SNAP recipients in rural Kentucky did not reduce food insecurity, but summer EBT payments to families with children did. The Department of Health and Human Services’ Healthy People 2030 adopted food insecurity as a leading health indicator with a goal of reducing it to 6%. They adopted a second leading health indicator of very low food security among children (meaning that the child often does not have enough to eat), with the goal of eliminating this condition entirely. In 2023, 1% of children in the United States experienced very low food security.
What this Means:
The Food Security Survey is a valuable source of information on the economic well-being of low- and moderate-income Americans. The federal collection of food security data is not redundant. There are many ways that we can, and do, measure households’ economic well-being: their income, income relative to the poverty threshold, whether the adults are unemployed, how much they spend on household necessities, and other measures. Research has consistently shown that food insecurity is an important measure of economic health that is related to these other measures but captures different aspects of economic well-being. While no data collection is free, the USDA survey is a good investment that makes use of other federal data infrastructure to minimize the survey cost and maximize the information garnered. Failing to collect this information at the same time that other pressures — such as large cuts in safety net programs and price increases — may drive up the rate of hardship will make it harder to monitor economic well-being among lower-income Americans.
Like what you’re reading? Subscribe to EconoFact Premium for exclusive additional content, and invitations to Q&A’s with leading economists.