What Does the Stock Market Tell us About Politics?
Boston University and Dartmouth College
The Issue:
Politicians often take credit for a rise in the stock market, which is viewed as an indicator of a robust economy. But politics has a much more limited effect on the overall economy than on particular industries, or even particular companies, whose fortunes rise or fall with changes in tax, trade or regulatory policies. Tracking changes in the stock prices of companies or industries that are likely to be impacted by specific policies can provide a more fine-tuned gauge of the market's expectations that the policies will be implemented.Changes to stock prices can offer insight into the market’s perception of which companies will gain or lose from government policy changes.
The Facts:
- Government policies create winners and losers. The stock prices of companies can offer useful insight into the market’s perception of which companies will gain, and which will lose, from policy changes. The price of a company’s stock reflects investors’ beliefs about its future profitability. An increase in the price of a share of Apple, for instance, indicates investors believe its prospects have improved while a decrease means investors have downgraded their profit expectations. Thus, the stock market can be seen as an information clearinghouse focused on the expected performance of companies whose shares are publicly traded. Changes in government policies and regulations will affect publicly traded companies’ profitability, and therefore their stock prices. But, because investors are looking to the future, the change in the company's stock will happen at the time there is news about a new policy or a change in the expectations that a policy will be implemented, which could be well before the policy is actually implemented. There is an established body of economic research that examines changes in stock prices in response to political events to understand market expectations of the economic consequences of those events (for examples see this recent study of stock market responses to the 2016 election and this study for an international context).
- The 2016 U.S. presidential election represents one of the biggest political surprises in recent history. Companies and investors had to adjust their expectations of which types of policies were likely to be pursued by the federal government practically overnight. The stock market's overall gain on November 9 reflected an overall perception that a Trump administration would be more favorable to business interests than a Clinton administration. But some stocks did far better than others. That day saw particularly strong gains for financial services, on expectations of financial deregulation. Oil stocks did well, while share prices for renewable energy companies suffered. Companies that paid relatively high tax rates saw relatively strong gains that day, indicating investor expectations of a tax cut. Companies facing stiff import competition also did well, as would be expected if Donald Trump’s America First rhetoric were to translate into more restrictive policies towards imports.
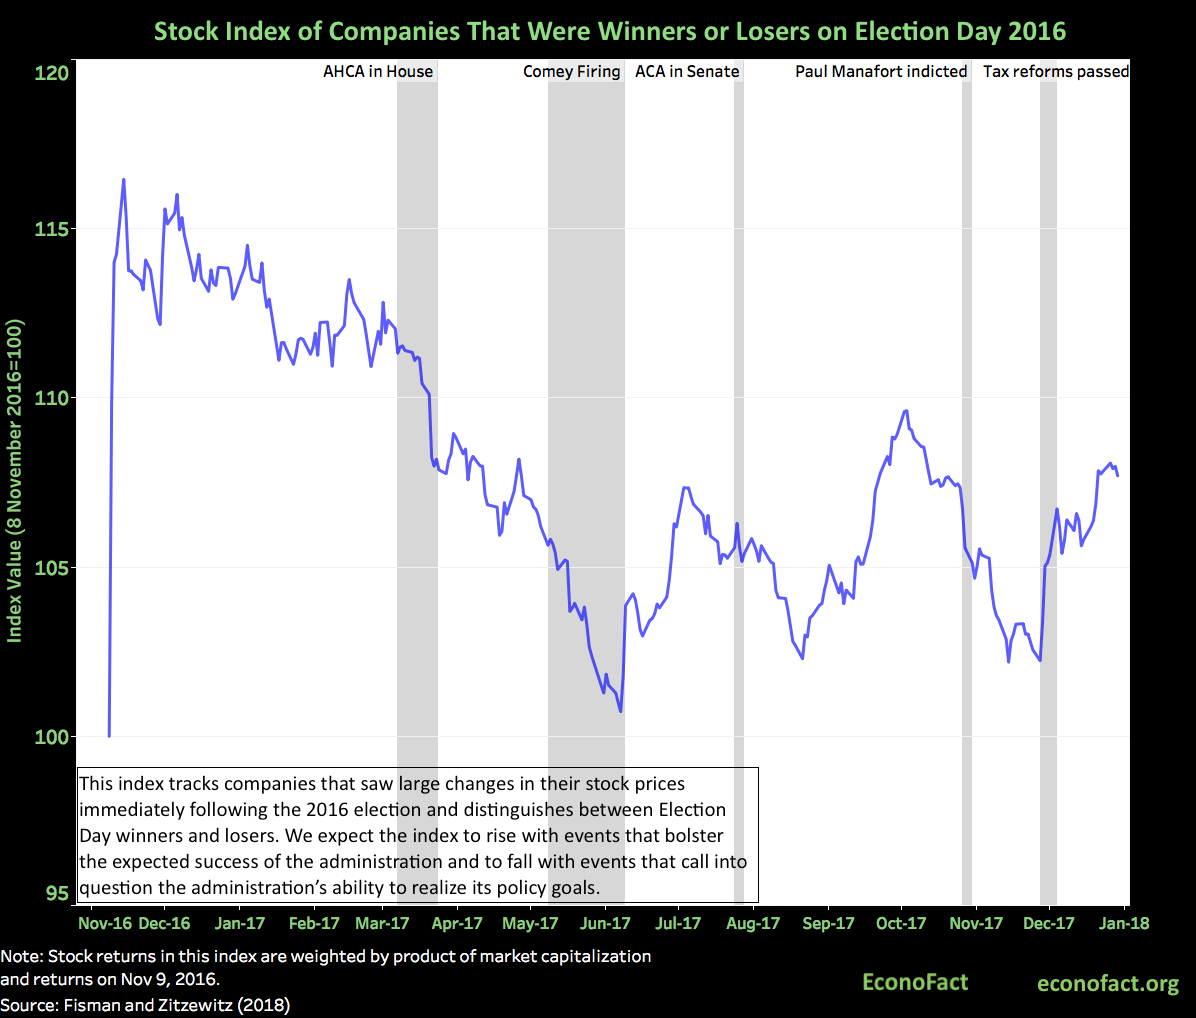
- Beyond Election Day, tracking the stocks of companies that saw big changes in response to the election can provide information of the market's evolving perception of the Trump administration’s expected success in executing its policies. In that spirit, we construct an index that is the difference between stock prices of companies whose share prices rose and those whose share prices fell on November 9th, 2016, as markets reacted to the previous evening’s surprise that Donald Trump, rather than Hilary Clinton, would be the next president. The movement in a company’s stock price reflected the expected effect on its profits of the likely policies of a Trump, rather than a Clinton, administration. Our “Trump Policy Index" is set to 100 on November 8th, 2016, and then rises to 115 the next day. We expect the index to rise with events that bolster the expected success of the administration and to fall with events that call into question the administration’s ability to realize its policy goals. The figure shows how this index performed in the 15 months after the election. The figure also includes shaded areas reflecting important political events that shape the views of the administration’s ability to achieve its policy goals. (See here for analysis of how different components of the index have independently performed).
- One source of movement in the index reflects perceptions of the ability of the Trump administration and the Republican Congress to achieve their policy goals. A high-profile indicator of this was the fate of the Affordable Care Act (ACA, also known as Obamacare), which President-elect Trump pledged to repeal as one of his first acts as President. The index remained steady, between 112 and 115, through mid-March 2017 but then fell at the time of the introduction on March 7, 2017 of the hastily-drafted Republican American Health Care Act (AHCA), which was meant to repeal Obamacare. The index continued to decline with the subsequent failure to pass AHCA in the House of Representatives on March 24. The index increased slightly with the Senate voted 51-50 to open debate on ACA repeal on July 25, but then fell when repeal failed to pass (51 – 49) three days later.
- The most notable policy success for President Trump and the Republican Party since the election was the passage of tax reform in December 2017. This led, naturally, to higher returns for companies that had faced relatively high tax rates. More broadly, it also led to an increase in the value of companies that had performed well on Election Day (even those that didn’t have especially high tax rates), perhaps indicating that investors saw the success in tax reform as indicative of President Trump’s ability to act on his other campaign promises.
- Movements in the index also reflect political events that raised questions about the Trump administration’s longevity and its political capital as it faced questions about Russian interference in the campaign as well as the possible obstruction of justice by the President and his staff. The firing of FBI Director James Comey on May 9, 2017 was followed by a sharp decline in the index over the following weeks. The index gained ground on June 8 when Comey’s testimony to Congress failed to produce any more damaging evidence. The index rallied as President Trump’s approval ratings and reelection odds improved during September, as captured by daily polls taken and wagers placed on the website of U.K. bookmaker Betfair.com. But then it sharply declined at the time of the indictment of one-time Trump campaign director Paul Manafort on October 30, 2017, an event that was seen as ratcheting up the investigation of the special counsel Robert Mueller.
What this Means:
The change in stock prices in the immediate wake of the election of President Trump reflected the expected changes in policies that would favor some companies, like those that would benefit from financial and environmental deregulation, and hurt others, like those that are hurt by a trade war or had been favored by policies to promote clean energy. The evolution of an index distinguishing between Election Day winners and losers offers insights into perceptions of the ability of the Trump administration to enact its policies, both because of legislative victories or defeats and because of the threats to the administration of the ongoing investigations of its ties to Russian influencers in the election and its alleged obstruction of justice. The analysis here illustrates a stark way in which politics affects the distribution of gains and losses across companies and industries.
Like what you’re reading? Subscribe to EconoFact Premium for exclusive additional content, and invitations to Q&A’s with leading economists.