What Information Does the Yield Curve Yield? (UPDATED)
Fletcher School, Tufts University
The Issue:
Forecasting the twists and turns of the economy is difficult. One set of indicators used to gauge where the economy is headed draws on information from financial markets since the yields paid by financial assets reflect the collective market view of the future state of the economy. An inverted yield curve — when interest rates on short-term Treasury bonds exceed those on longer-term Treasury bonds — has in the past proven to be an indicator of an oncoming recession. As of early December, the difference in yields between shorter- and longer-term Treasury bonds had inverted for the three-year five-year rate, and the two-year five-year rate, while the two-year and ten-year rate had continued to narrow, reaching 11 basis points. The movements in the yield curve, as well as in other financial market indicators, have raised concerns that the current long expansion of the United States economy may be coming to an end.An inverted yield curve — when interest rates on short-term Treasury bonds exceed those on longer-term Treasury bonds — has in the past proven to be an indicator of an oncoming recession.
The Facts:
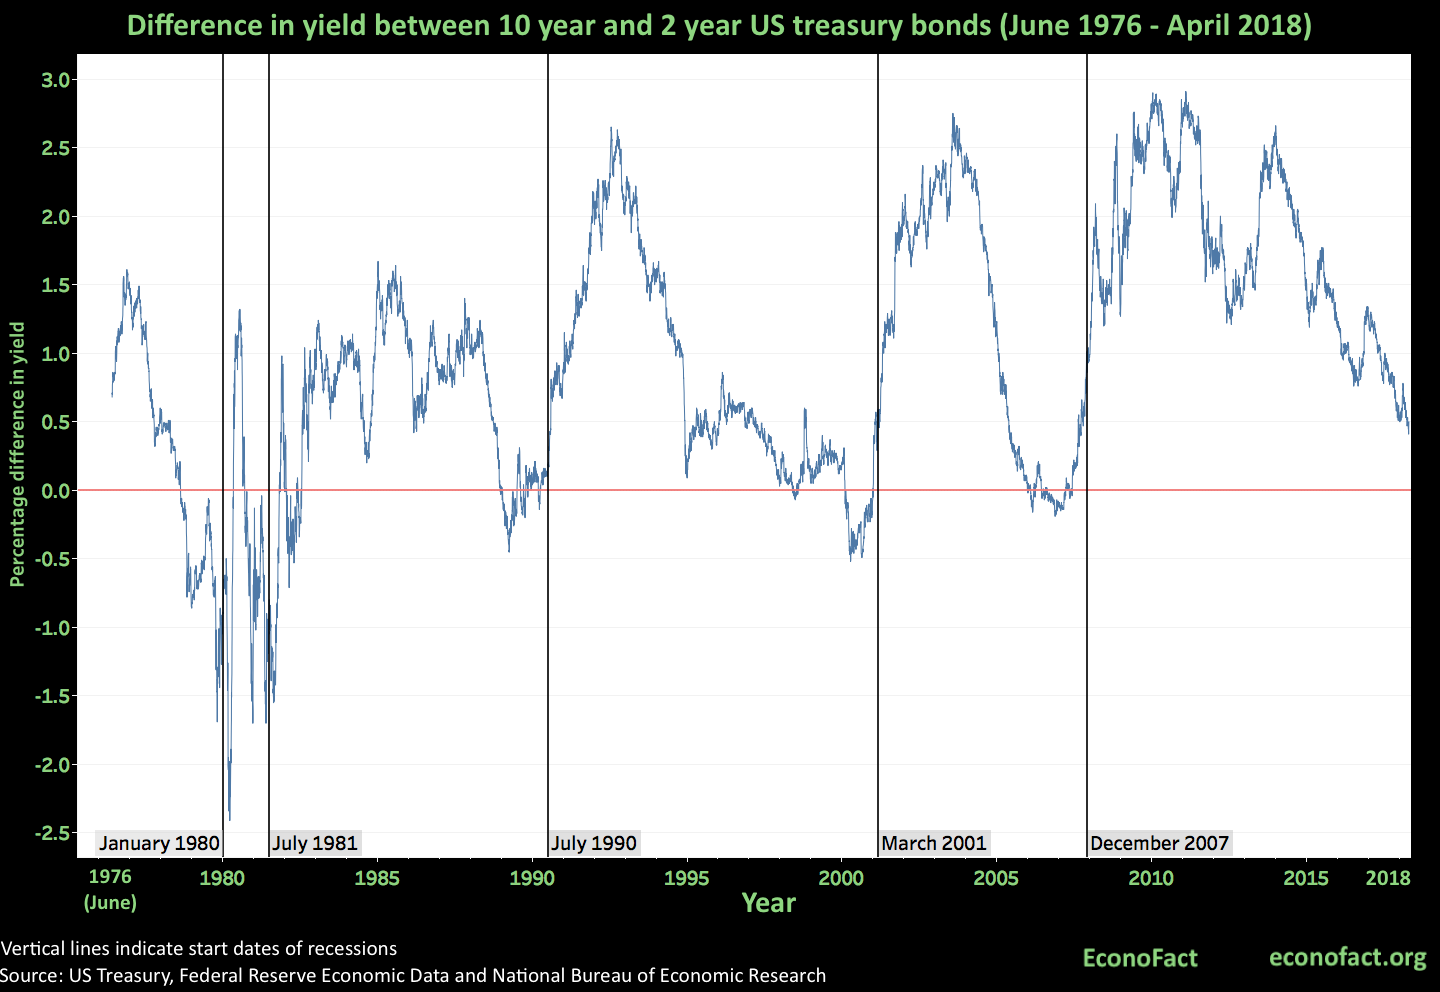
- Before the start of every economic recession in the United States since the mid-1970s, the difference in yields between 10-year and 2-year U.S. Treasury bonds turned negative — meaning that the 10-year bond offered a lower interest rate than the 2-year bond (see chart). The figure plots the difference in the 10-year and 2-year Treasury yields, from June 1976 through April 2018, with vertical lines representing the starting dates of recessions, as determined by the National Bureau of Economic Research. A negative value preceded every recession since the mid-1970s. The difference in the 10-year and 2-year yields is one example of different comparisons that can be made of bonds with different maturities (for instance, others may look at the spread between the ten-year constant maturity rate and the three-month secondary market rate). Rather than selecting two particular maturities, one can also consider more broadly the overall shape of the yield curve, which plots the interest rates on bonds of different maturities. The yield curve typically slopes upwards, with interest rates higher on longer-maturity bonds than on shorter-maturity bonds. An inverted yield curve, where interest rates on shorter-maturity bonds exceed those of longer-maturity bonds (like a negative value of the difference in the 10-year and 2-year yields), is often seen as a harbinger of a recession. The difference between the ten-year and two-year Treasury rates has decreased from 126 basis points (1.26 percent) in November 2016 to about 11 basis points in December 2018, which is its lowest value since October 2007. Likewise, the yield curve has flattened.
- While a negative spread between the 10- and 2-year Treasuries is a strong predictor of a subsequent recession, there is no single well-accepted theory of why this relationship, or more generally an inverted yield curve, predicts a recession. To understand the possible relationship between the yield curve and the future state of the economy, it is first necessary to consider three factors reflected in the interest rate: the real interest rate, which is the return from a physical asset, like plant and equipment, since bonds compete with these other assets for investors’ funding; the inflation rate that is expected to prevail over the time that the bond is held, since inflation erodes the value of the money that is received when the bond matures; and a term premium that compensates people for not currently consuming goods and services, as well as for the risk that the bond issuer may default. The term premium is higher for longer-maturity bonds than for shorter-maturity bonds, and this is an important reason why the yield curve normally has a positive slope. When longer-maturity bonds offer lower yields relative to shorter-maturity bonds, it may be because investors expect lower future inflation, which might arise with a future slump in economic activity. Another potential reason why an inverted yield curve predicts a downturn is that efforts by the Federal Reserve to slow the economy and prevent overheating typically involve raising the Federal Funds rate, which has a bigger effect on short-maturity interest rates than on longer-maturity interest rates. In fact, long-term yields might remain largely unchanged with an increase in short rates if markets are confident long-run inflation is well controlled, a situation that is especially likely when the Federal Reserve has a long record of keeping inflation low, as is the case currently.
- The time between when the difference in the ten-year and two-year Treasuries turned negative (or, more generally, when the yield curve inverted), and the onset of the subsequent recession has varied from one episode to another. For the recessions that preceded the Great Recession, the time between the first negative value of this spread, and the onset of the recession ranged from 10 months (for the recession that began in July 1981) to 18 months (for the recession that began in July 1990). This time lapse sometimes generates uncertainty regarding whether the ability of the inverted yield curve to presage recessions continues to hold. When the U.S. economy continued to grow after the difference between the ten-year and two-year Treasuries turned negative in December 2005, this raised some questions about the predictive value of this indicator during 2006. However, the economy did ultimately enter a recession in December 2007. The spread hovered around zero after December 2005, with its last negative value in May 2007, seven months before the beginning of the Great Recession.
- Concerns about the possibility of an upcoming recession based on the flattening of the yield curve and the reduction in the spread between the ten-year and two-year Treasuries are consistent with some other indicators and forecasts, but not all point in this direction. In its October, 2108, global outlook report, analysts at the International Monetary Fund (IMF) stated that the downside risks to global growth had increased and, while the momentum of the U.S. economy was still strong due to continuing fiscal stimulus, it revised down the forecast for U.S. growth for 2019 due to ongoing trade tensions. Earlier in the year, The Economist magazine reported that two other financial market indicators that typically presage a recession, the difference between the London Interbank Offered Rate (LIBOR) and the Overnight Index Swap Rate (OIS), as well as the VIX, an indicator of financial market volatility, also point towards an upcoming recession. However, when asked whether the inverted two- and three-year Treasury yields could be a warning bell of an economic slowdown or recession, John Williams, the President of the Federal Reserve Bank of New York, said on December 4, 2018 that he was "still of the view that with the economy on a very strong path with a lot of momentum, especially with some of the fiscal ... tailwinds and other factors, that further gradual increases over the next year or so still makes sense.”
What this Means:
The current expansion of the U.S. economy is among the longest on record. There have been 33 recessions since 1854, and, given the length of this expansion, one may think that we are now due for another downturn. The fiscal stimulus arising from the tax cut passed at the end of last year may keep the economy growing for some time, but this effect is expected to eventually wear off. While the Federal Reserve has shown a willingness to raise interest rates to prevent overheating, Federal Reserve Chairman Jerome Powell has recently indicated that interest rates are “just below” broad estimates of a neutral level — a setting designed to neither speed nor slow economic growth. Still, predicting recessions is a notoriously difficult endeavor, as pointed out by Nobel Laureate Robert Shiller. Nevertheless, there are some warning signs, among them the flattening of the yield curve and the decrease in the spread between 10-year and 2-year Treasuries – and these warnings would become stronger were these movements to continue in the same direction.
Like what you’re reading? Subscribe to EconoFact Premium for exclusive additional content, and invitations to Q&A’s with leading economists.