How Fast Did the Economy Grow Last Year?
Fletcher School, Tufts University and George Washington University and The Hamilton Project, Brookings Institution
The Issue:
The growth of Gross Domestic Product (GDP) is one of the most visible measures of economic performance. There are concerns with GDP as a measure of well-being: for example, it does not include non-market production that people value (such as parents caring for children or charitable work) nor does it take into account environmental degradation. But there is a more mundane issue; there can be big differences in GDP growth depending upon whether that statistic is calculated over a given year, such as from the end of the previous year to the end of the current year, or by comparing GDP in one calendar year to GDP in the previous year.
The differences in these calculations can make, and have made, a sizable difference in reports of how the economy is performing.
The Facts:
- When reporting GDP growth in a calendar year, say 2018, one could compare GDP in 2018 to GDP in 2017. This is known as annual average or Year-to-Year (Y/Y) GDP growth. International organizations like the International Monetary Fund (IMF) and the World Bank calculate country-level GDP growth and GDP growth for the world as a whole using this method. In fact, this is the only feasible method for calculating GDP growth when, as is the case with many countries, GDP is only reported on an annual basis.
- Calculating GDP growth using this Year-to-Year method can also be done for countries that report GDP more often, for example every quarter, by summing up GDP across the quarters in each year (or taking the average of the reported annualized GDP levels) and looking at the change from one year to the next. This method is accurate for what it explicitly measures, growth from one calendar year to the next calendar year, but it can be misleading about how much the economy grew in a given twelve-month period. A simple example illustrates this. Suppose GDP was 100 in each of the first three quarters of 2017 but then rose to 104 in the fourth quarter and stayed at 104 throughout 2018. The average GDP for 2017 is 101 (the average of 100, 100, 100 and 104), the average GDP for 2018 is 104 (since it is unvarying over that year), so the Year-to-Year calculation shows that GDP growth was about 3 percent (calculated as ((104 – 101)/101) ×100% = 2.97 percent). But there was, in fact, no change in GDP during 2018 since it started the year at 104 and ended the year at 104.
- An alternative measure using quarterly data calculates growth by considering the level of GDP in a particular quarter compared to its level one year (four quarters) earlier. For an annual measure, this would compare the level of GDP in the last quarter of a year to its level in the last quarter of the previous year (Q4/Q4 growth). This provides a more accurate picture of the growth of GDP during a given year for the example given above. In that example, the 2018 Q4/Q4 growth rate is 0 percent since the level of GDP is 104 in both the fourth quarter of 2017 (2017:Q4) and the fourth quarter of 2018 (2018:Q4). In contrast, the Year-to-Year method gives an answer that reflects growth in both 2017 and 2018. (The Year-to-Year method gives the following approximate weights to each quarter’s annualized GDP growth rate: 1/16 in 2017:Q2 and 2018:Q4; 2/16 in 2017:Q3 and 2018:Q3; 3/16 in 2017:Q4 and 2018:Q2; and 4/16 in 2018:Q1).
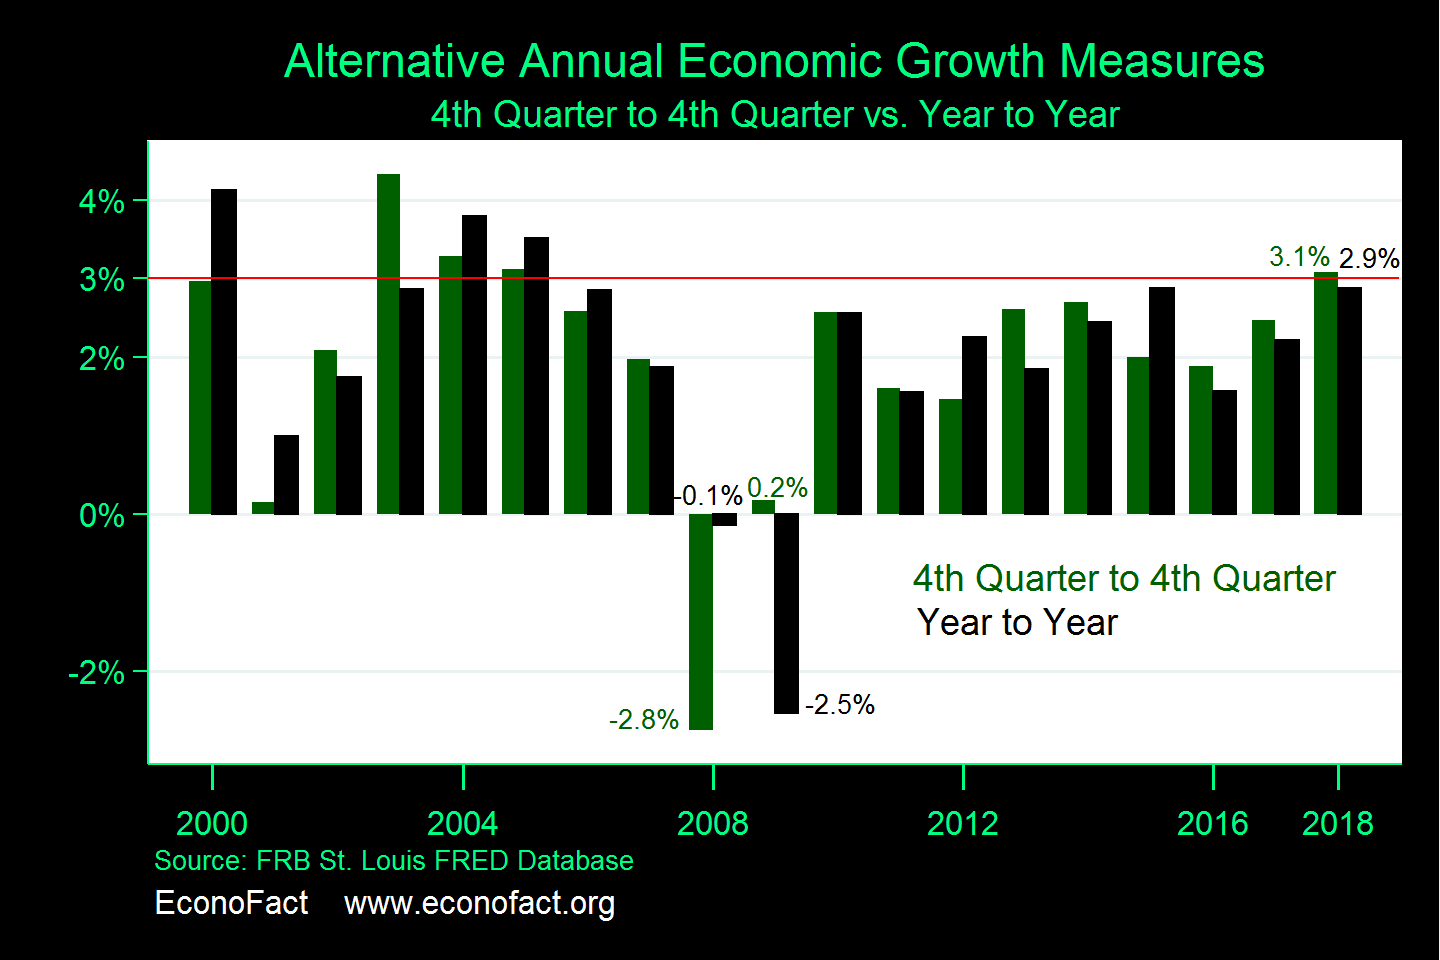
- As suggested by the numerical example, the difference between the Year-to-Year and Q4/Q4 growth calculations is particularly large when the economy has a big change in the latter quarters of a year. A notable example occurred in 2009 when, as shown in the figure, the Year-to-Year growth rates was -2.5 percent. The economy had begun to recover from the Great Recession during this period, with the recession formally ending in June of 2009. Over the course of 2009, output rose slightly (0.2 percent on a Q4/Q4 basis) and the quarterly GDP growth in the second half of that year was slightly higher than the contraction in the first half of the year. But because output fell so sharply when the Great Recession began in the fourth quarter of 2008, declining 8.7 percent on an annual basis, 2009 began with GDP well below the annual average of 2008. This gave rise to the 2.5 percent Year-to-Year decline in GDP.
- The large divergence of Year-to-Year and Q4/Q4 growth rates that occurred at the outset of the Great Recession was not typical. But even small divergences can have big political effects. Most recently, the 2018 GDP growth rate was 2.9 percent when calculated on a Year-to-Year basis, but 3.1 percent when calculated on a Q4/Q4 basis. This means that one measure is below the politically sensitive 3 percent threshold while the other is above it (with data as of February 28, 2019, but the data will be revised in March). As New York Times reporter Ben Cassleman writes, the difference between 2.9 percent and 3.1 percent is statistically negligible (especially since the fourth quarter data will be revised) but politically important given that the Administration had predicted GDP growth of 3 percent.
- Another advantage of calculating growth by considering the difference across four quarters is that one is not restricted to calendar years but could consider, say, Q2/Q2 or Q3/Q3 growth. This, too, can change messages. The best Year-to-Year figure during the Obama Administration was 2.9 percent in 2015 – but, as noted by MarketWatch columnist Rex Nutting, growth was 3.8 percent from 2014:Q1 to 2015:Q1, which exceeds the most-recent 3.1 percent that is the highest Q4/Q4 growth rate (or any growth rate calculated over four quarters) during the current administration.
What this Means:
Generations of economists at the Council of Economic Advisers have been taught the differences between Year-to-Year and Q4/Q4 calculations by Steve Braun, the Chief Macroeconomic Forecaster who has served both Republican and Democratic administrations since 1996. The discrepancies across the two main ways of calculating GDP growth do not reflect incorrect mathematics or the distortion of statistics, it is simply a reflection that these methods can yield different results. The differences are especially stark when the economy goes through sudden, sharp changes in GDP. When discussing growth that took place during a given year, it is better to use Q4/Q4 statistics if possible, but in some cases, only annual data are available. As with any statistical methodology, it is important to know the way in which differences can arise across different types of calculations, to recognize that consistency of methodology across time allows for fair comparisons, and to make sure that changes in methodology are not undertaken purely for reasons of messaging or to distort results for political gain.
Like what you’re reading? Subscribe to EconoFact Premium for exclusive additional content, and invitations to Q&A’s with leading economists.