Is the U.S. Stock Market Fairly Valued?
Dartmouth College
The Issue:
The United States stock market dropped sharply when COVID emerged in March 2020, but recovered even more dramatically afterwards, finishing 2021 up 47% from its end-of-2019 level. Although its current value remains well above its pre-pandemic levels, the stock market has given up about half of those gains since the beginning of 2022, as fears of a recession mount. This has generated a lively debate on whether the market is currently fairly valued and what that means for its future prospects. The theory of equity prices and a historical perspective on benchmark values for the stock market offer some insights on its current value and reasons for its volatility.
The key for whether the S&P 500 is fairly valued at its end-May 2022 level is whether we expect the level of earnings in 2021 to be sustainable.
The Facts:
- Stock prices reflect expectations of future events and this has implications for stock price volatility. The price of a corporation's stock reflects the current expected value of its future dividend payments, adjusted for risk. The role of expectations is key – the value of the aggregate stock market, as reflected in indexes like the Standard and Poor's 500, will change immediately today with new information about the prospects for economic growth, interest rates, rules and regulations that affect corporations, political factors, or a host of other reasons. For example, new information that raises the prospect of a recession will tend to lower stock prices as soon as that information becomes publicly available. This immediate impact of news, rather than actual changes in conditions, makes stock prices volatile. There are many examples of this, such as the stock market responses to elections, post-election political developments, the pandemic, and war.
- Assessments of the fair valuation of aggregate stock indexes typically use currently available information rather than people's expectations of the future, since reliable measures of expectations are difficult to obtain. One popular indicator is the market value of a corporation's stock (the stock price times the number of shares) as compared to its annual earnings to calculate that corporation's price-earnings ratio (P/E). The aggregate price-earnings ratio for the stock market as a whole calculates the sum of the market values of all publicly traded firms divided by the total annual profits of these firms. Profits are likely to be higher in a strong economy and lower during a recession, all else equal, so John Campbell and Robert Shiller developed the Cyclically Adjusted Price Earnings (CAPE) ratio to capture this. CAPE divides the value of the S&P 500 index by the average annual earnings of firms in the index over the prior 10 years; this longer-run average is used to smooth out the effects of the business cycle. The P/E and CAPE ratios can be compared to historical averages to gauge whether the stock market is fairly valued, as compared to over-valued or under-valued. For example, at 32.1 the CAPE ratio on June 3rd, 2022 was below its maximum value of 44.2 (reached in December 1999) but well above it trough of 13.3 in March 2009.
- The most recent decline in the CAPE ratio occurred mostly through falling stock prices rather than increasing earnings – and this is consistent with historical experiences of falling CAPE ratios. A decline in the CAPE ratio occurs through either a decline in stock prices, an increase in earnings, or both. The recent 15 percent decline in the CAPE from 38.3 at the end of 2021 to its May value of 32.5 represented an 11 percent decline in the S&P 500 index (from 4675 to 4132) and a 4 percent increase in 10-year-average earnings (from 122 to 127).
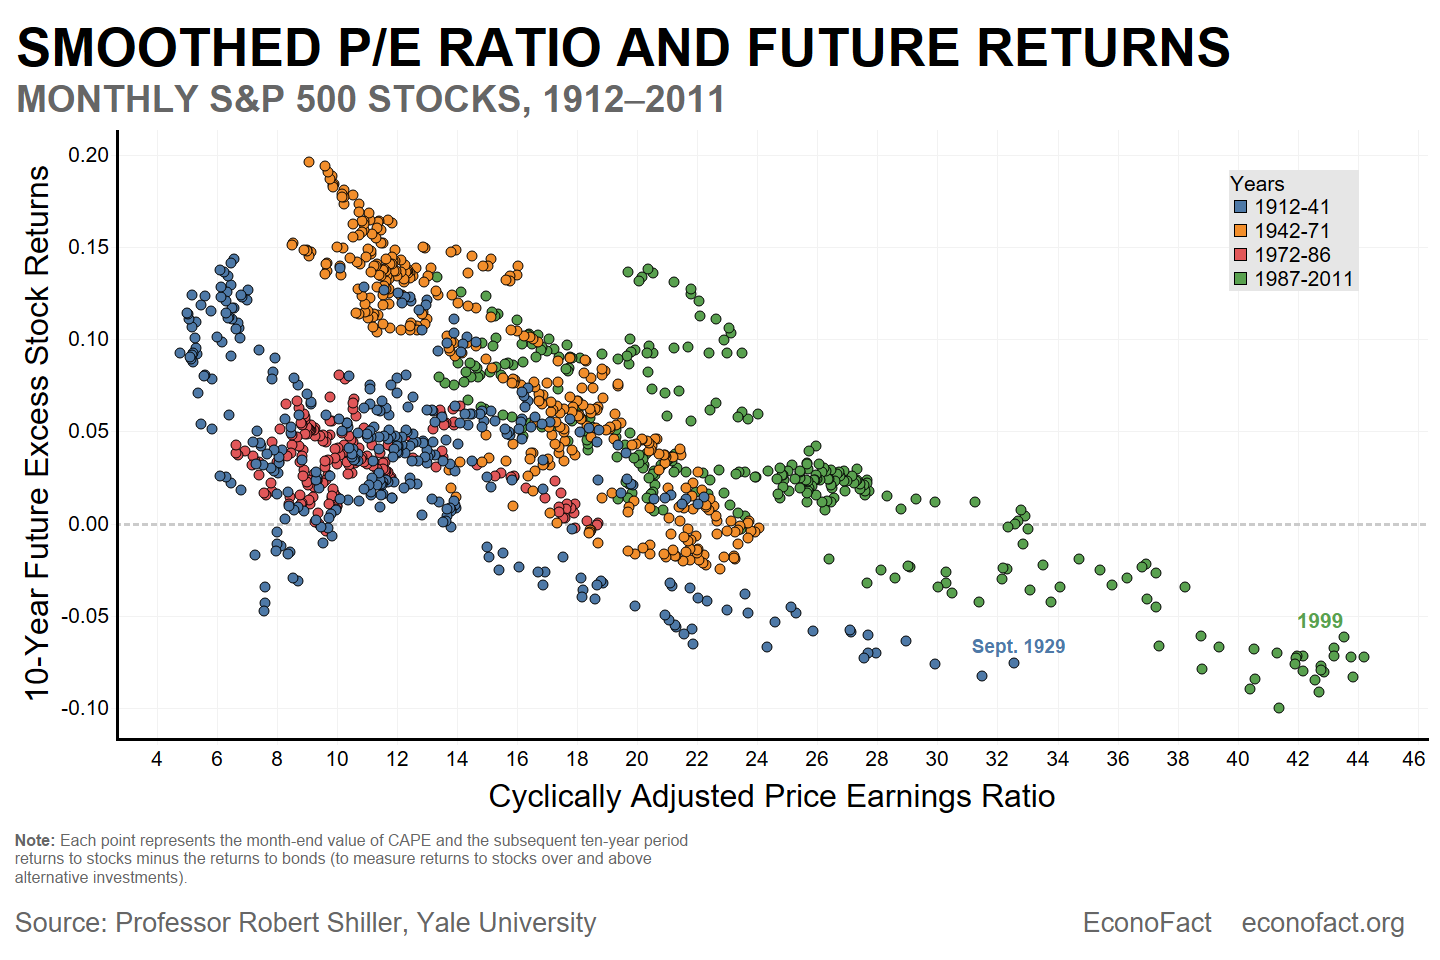
- High values of the CAPE ratio are typically followed by falling stock prices. There tends to be an inverse relationship between the value of the CAPE ratio at a given time and the returns to stock prices over the subsequent decade (see chart). Each of the 1,200 monthly data points represents the month-end value of the CAPE ratio and stock returns over the subsequent ten-year period. The downward sloping relationship suggests that high values of CAPE reflect periods of overvaluation potentially driven by easy credit or the irrational exuberance of investors chasing strong recent returns. That said, there is much less independent data in the graph than there appears to be, since the observations of returns are from highly overlapping periods. In some sense, we have only two past observations of a CAPE above 30, 1929 and 1999 – and at both of these times there were subsequent stock price declines. But it should be noted that the relationship between CAPE and future returns appears to change over time – note that the level of CAPE consistent with modestly positive future returns was higher in the most recent period (in orange) as compared to 1912 – 1941 period. The variations in the CAPE – stock return relationship over time suggests that the level of CAPE consistent with fair valuation may vary as well.
- There are reasons that a higher-than-normal CAPE might be appropriate in 2022. First, interest rates are lower than inflation, so the real interest rate (the nominal rate minus the inflation rate) is negative. This should increase the amount an investor should be willing to pay for $1 of current earnings since earnings (and the dividends they fund) should grow with inflation while the alternative of holding a bond rather than a stock is less attractive because of still low nominal interest rates. Second, high price-earnings ratios in the United States partly reflect a sectoral sorting between the United States and Europe in which the United States has more high-growth technology companies and Europe more slower-growing consumer goods corporations. Third, CAPE, by design, underreacts to recent earnings growth. Earnings have grown very rapidly in the last decade: After not growing at all per unit of the S&P 500 between 2006 and 2016, earnings have almost doubled in 5 years, adjusted for inflation. When attempting to predict future performance using past performance, it is sensible to put more weight on more recent performance. CAPE does not do this; in benchmarking value against equal-weighted average prior earnings, it implicitly takes the 10-year average as its prediction of future earnings. Valuations in 2021 look less like an outlier if we benchmark them with prior-year earnings, as in the simple P/E ratio.
What this Means:
The key question for whether the S&P 500 is fairly valued at its end-May 2022 level is whether we expect the level of earnings in 2021 (roughly 200 per unit of the index) to be sustainable. First quarter earnings for 2022 were strong, helped by the energy sector, and analyst forecasts for the rest of 2022 and 2023 are as well and indeed have strengthened since the end of the year. But there are alternative views; Chicago Mercantile Exchange dividend futures, whose payoffs are tied to the dividends paid per unit of the S&P 500 in a future calendar year, have declined by 10-15% for years 2024 and later, roughly matching the decline in stock prices. These markets appear unconvinced by the analysts’ optimism. Much is currently being written about how inflation, and the fight against it, will affect earnings. My own view is that the lessons we can draw from the 1970s, when high inflation was accompanied by stagnant earnings, are limited. It matters whether inflation is driven by increases in the costs faced by S&P 500 firms or whether it is driven by their ability to raise the amount by which they mark up their costs. It matters what form any recession induced by inflation fighting takes. Earnings releases are being watched even more closely than they normally are for clues to these questions. While the high value of metrics such as CAPE lead one to worry about overvaluation, even following the market decline early this year, I would argue that the level of CAPE consistent with a fair valuation of the market may well have risen. The key question is whether the high profits of 2021 turn out to be a post-pandemic blip or the new normal.
Topics:
Stock MarketsLike what you’re reading? Subscribe to EconoFact Premium for exclusive additional content, and invitations to Q&A’s with leading economists.