Rising Costs of Financing U.S. Government Debt
Brandeis University
The Issue:
As of September 30, 2022, the end of the most recent fiscal year, the United States Treasury had about $24 trillion in outstanding debt held by the public, representing about 93 percent of GDP. This is close to the highest value of debt relative to GDP since the end of World War II. At the same time, interest rates have risen across all types of debt in recent months, raising the cost of borrowing. This will have an impact on the Federal budget in ways that are not immediately transparent due to the various types of outstanding government debt.
Most of the current government debt will mature within the next three years. New borrowing, and debt that must be rolled over, will pay current market interest rates.
The Facts:
- The government’s bill for its interest payments on debt reflects the size of the debt and the interest rates on the debt. Government debt is the sum of current and accumulated past budget deficits as well as the cumulative cost of financing those deficits. Market interest rates vary with the maturity structure of debt – typically (though not always), longer maturity debt such as 30-year Treasury bonds will pay higher interest rates than shorter maturity debt such as 3-month Treasury bills. Market interest rates also vary depending upon whether the interest rate is fixed for the life of the bond or if it can be reset before the bond comes to maturity. New borrowing, and debt that must be rolled over, will pay current market interest rates.
- Borrowing costs have been rising across the U.S. economy as the Federal Reserve has been raising interest rates in an effort to curb inflation. The Fed started raising the federal funds rate in March of 2022. At that time the yield on the 10 year Treasury bill was under 2% (1.725). By its November meeting, the Fed had raised interest rates by three quarters of a point four times, bringing its target interest rate up to a range of 3.75-4 % (see here). Accordingly, the yield on the 10 year Treasury bill had also gone up to 3.6% (as of November 30). Interest rates on treasuries of different maturities had also risen: The 2-year went from 0.55 to 4.33% and the 30-year bill from 1.75-3.74% in the year ending on November 30.
- The Treasury does not decide how much to borrow, but how to borrow. The U.S. Treasury considers the tradeoffs involved in selling debt of different maturities and whether to choose fixed or adjustable rate bonds when deciding how to finance the current budget deficit and the rolling over of maturing debt. These tradeoffs involve the advantage of financing with short-term notes that frequently pay lower interest rates, and of an adjustable-rate structure, versus the disadvantage of the greater volatility in interest payments associated with both short-maturity debt (because of the need of more frequent rolling-over of the debt) and the use of adjustable-rate debt that can have a varying interest rate over time.
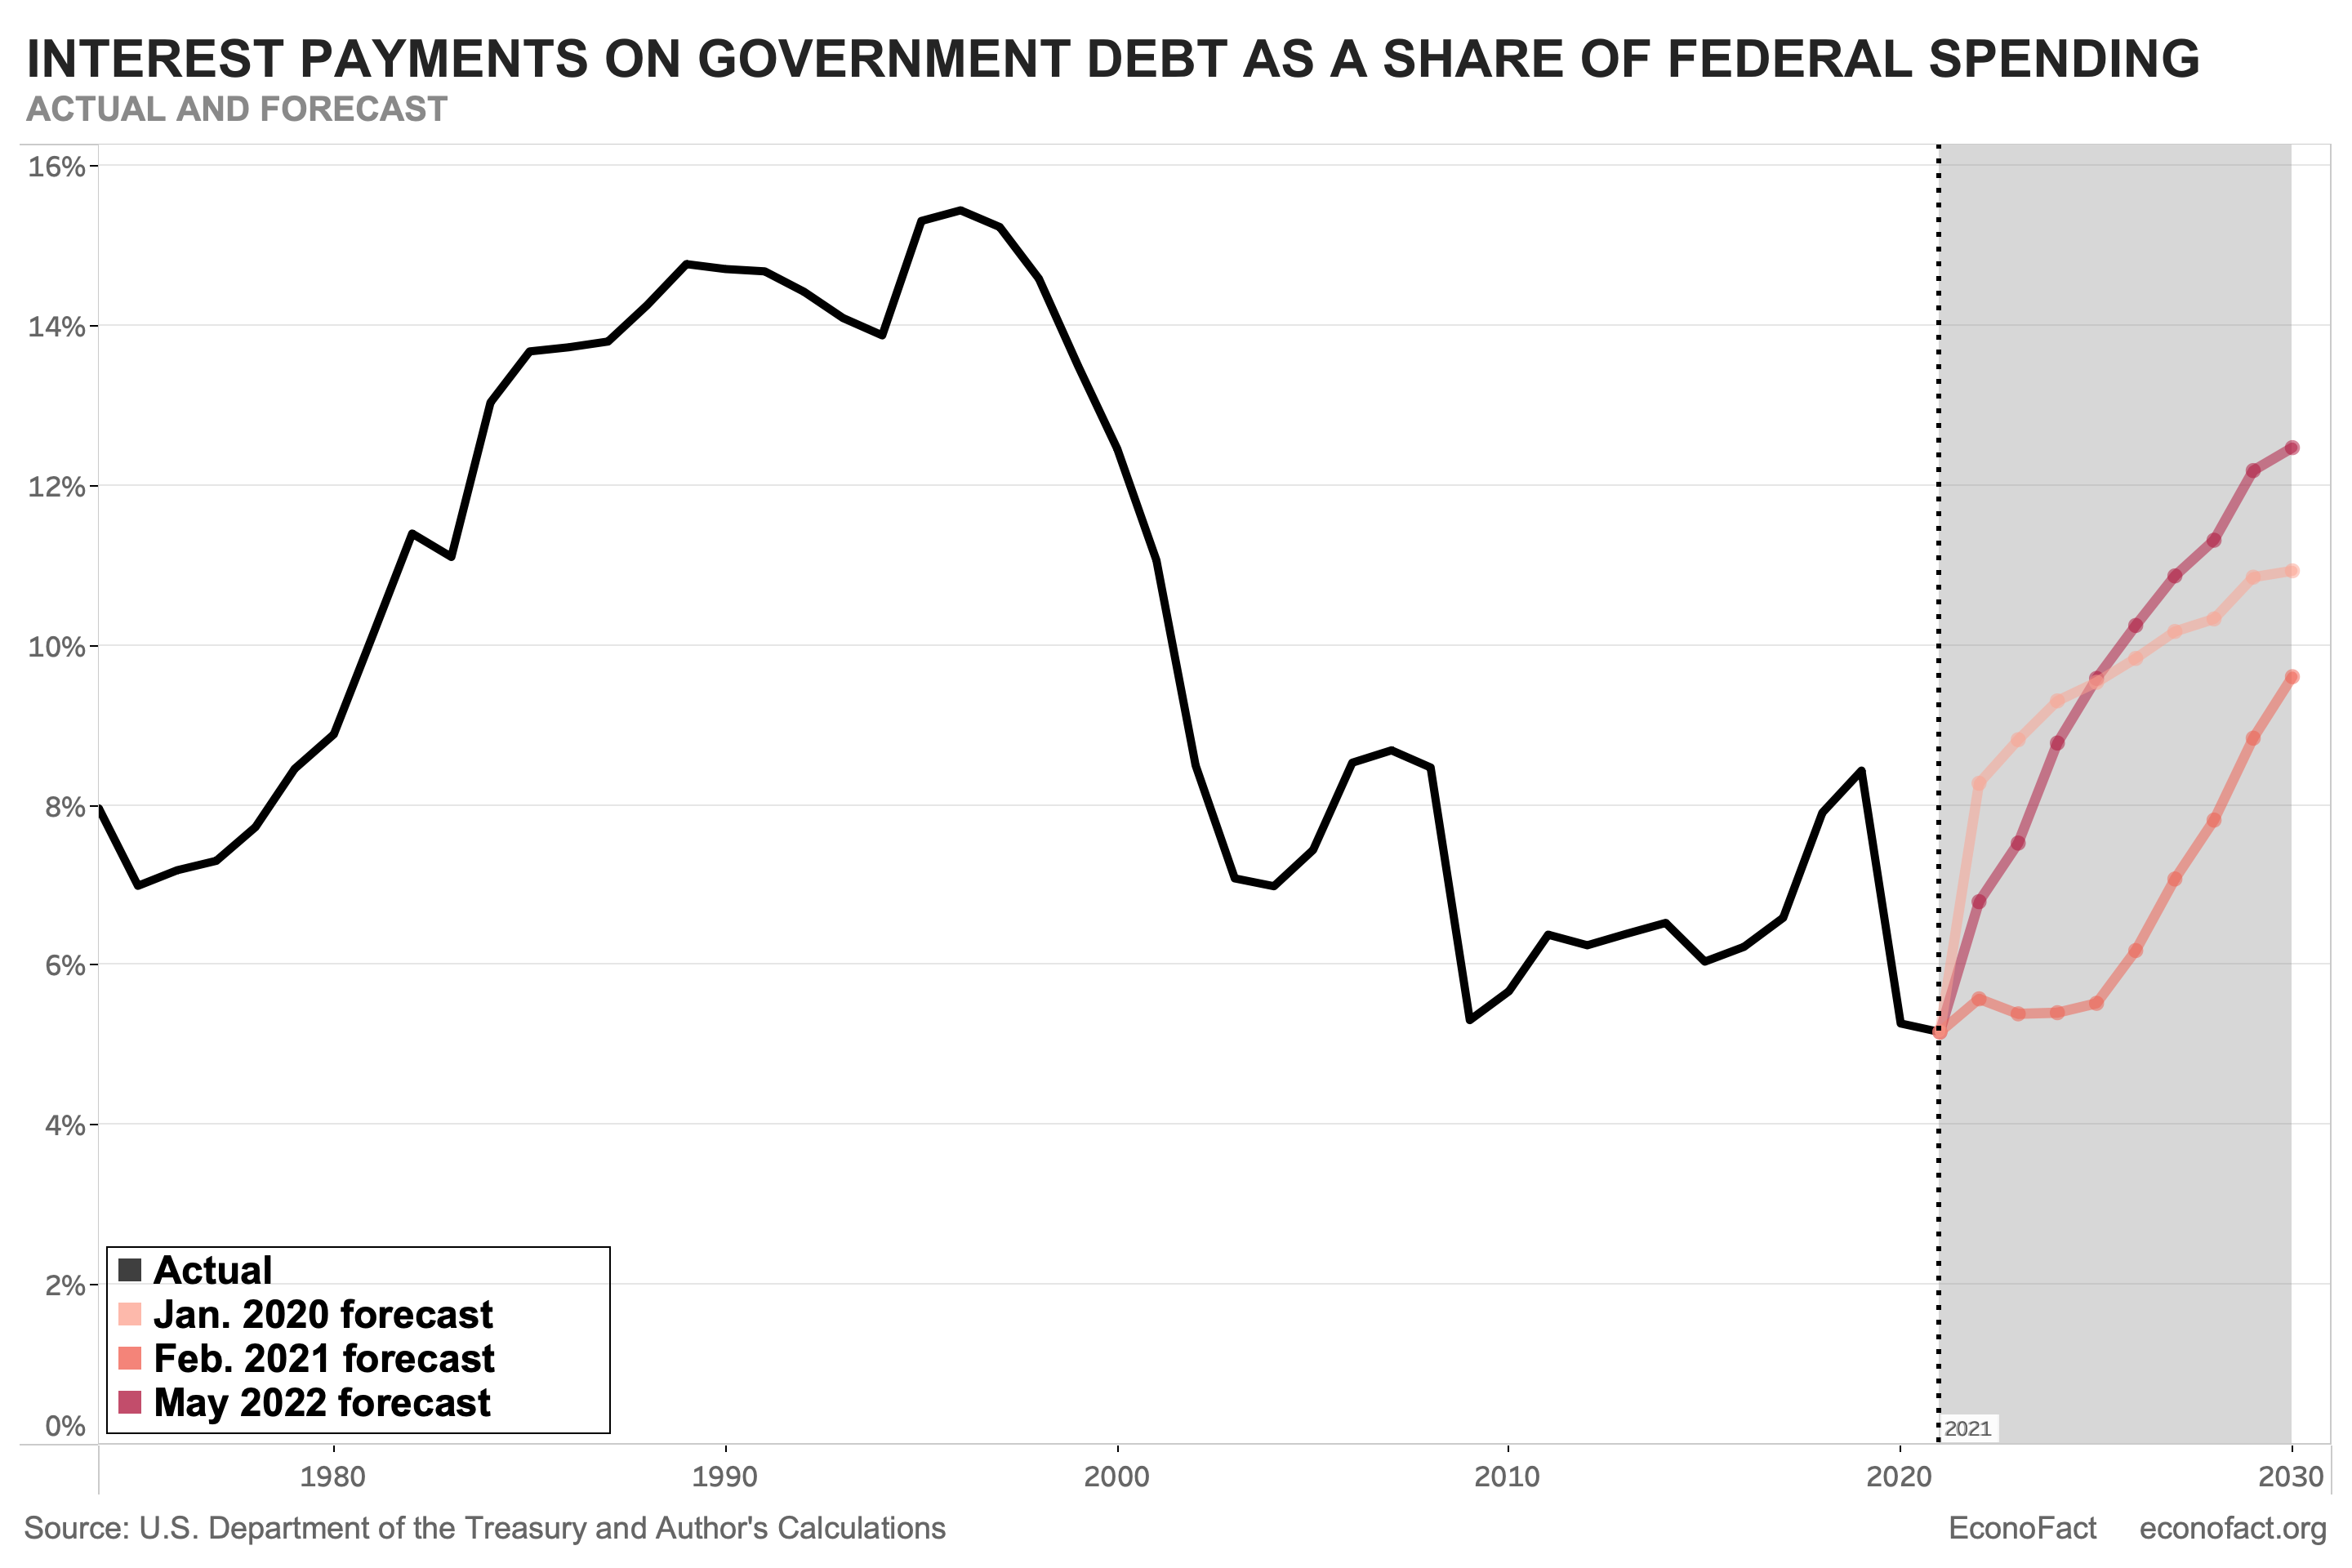
- The interest payments on debt have varied over time with the level of debt and the interest rate. Net interest payments rose from about 7 percent of total fiscal outlays in the mid-1970s to over 15 percent of fiscal outlays in the mid-1990s (see chart). This was at a time when the overall debt held by the public as a percentage of GDP grew from 23 percent to 48 percent. The reduction of debt payments from the mid-1990s to the mid-2010s reflects both lower interest rates and a lower level of debt. Although the debt-to-GDP ratio rose between 2009 and 2017, net interest payments as a share of total federal outlays remained below 7 percent during this period primarily because of low interest rates. Net interest payments on debt as a percentage of total fiscal outlays have now started to rise with the increase in interest rates.
- Looking forward, the interest payments on debt will depend upon, among other factors, how much debt will come due in the next few years. The U.S. Treasury issues debt with maturities as short as one month and as long as 30 years. The maturity structure of debt is the pattern of maturities of outstanding debt. The current maturity structure is such that most of the current debt will mature within the next three years. Thirty percent of this outstanding debt, amounting to $6.7 trillion, will mature and need to be refinanced during fiscal 2023. An additional $300 billion in floating-rate debt, while not maturing during fiscal 2023, pays interest rates that will reset with market rates during that year. An additional $2.5 trillion in debt maturing during 2023 will make coupon and principal payments that will be adjusted based on the inflation rate prevailing at that time.
- The maturity structure of debt matters for debt payments because interest rates on new and rolled over debt may be different from interest rates in the past. As an example, almost $7 trillion worth of debt held by the public will need to be refinanced during the 2023 fiscal year. Each percentage point increase in interest rates on that refinanced debt will mean $70 billion per year more in net interest payments in that first year, or about 10 percent of the United States defense budget requested for 2023. The graph shows the evolving sequence of forecasts made in recent years by the Congressional Budget Office (CBO) for the ratio of net interest payments to total fiscal outlays. The graph shows that the forecasts of the ratio of debt service to total fiscal outlays have shifted upward as interest rates have increased since September 2020. The most current forecast is that interest payments will reach and even exceed the percentages of the 1980s and at the turn of the century. This is partly due to an increase in the forecasts of Treasury bond yields of about 1.2 percentage points for 10-year yields and two percentage points for 3-month yields. But market interest rates since the CBO’s mid-2022 forecast have come in much higher than they forecast then; they are now more than 1 full percentage point higher than forecast for bonds with 10 years to maturity and 2 full percentage points higher than forecast for 3-month Treasury bills.
- Although sometimes it is claimed that inflation reduces the burden of debt as a share of that GDP, that may not be the case now. Increases in inflation raise nominal GDP, that is, GDP at current prices. For that reason it is sometimes claimed that inflation may reduce the burden of debt as a share of GDP. But interest rates on new debt, on floating rate debt, on inflation-adjusted debt, and debt being rolled over will also rise with inflation. Lenders will demand higher interest rates to compensate them for being paid back in dollars that are worth less in the future. The short maturity structure of outstanding debt means that much of the debt will be refinanced and the interest rates will reflect current and expected inflation. Thus, research suggests that inflation itself is unlikely to contribute much to a reduction in the debt-to-GDP ratio.
What this Means:
Rising levels of debt service contribute to fiscal challenges that our country faces. The cost of debt service will depend on both the level of debt outstanding and the level of interest rates. Debt has risen to levels that are high by historical standards, but — until last year — that increase has coincided with very low interest rates that have kept the costs of debt service relatively low. However, the high levels of debt mean that increases in interest rates like those that we have seen in the past year will either have a large impact on our country’s budget deficits or will require increases in taxes or reductions in spending.
Like what you’re reading? Subscribe to EconoFact Premium for exclusive additional content, and invitations to Q&A’s with leading economists.