What Different Measures of Inflation Tell Us
Wellesley College
 The Issue:
Measuring inflation — the rate of change in the level of prices — requires comparing the prices of a basket of goods and services over time. While that idea sounds straightforward in principle, measuring inflation in practice is more complicated. What goes into the chosen basket of items whose prices are to be tracked over time and how prices of these different components are combined can vary from one inflation gauge to another. That being said, no matter how you measure it, inflation is the highest it has been in the United States in decades. Some measures of inflation aim to capture changes in the overall cost of living while others are intended to gauge a more generalized trend. Moreover, the rate of inflation experienced by different households and different sectors of the economy can range widely.
Some measures of inflation aim to capture changes in the overall cost of living while others are intended to gauge a more generalized trend.
The Facts:
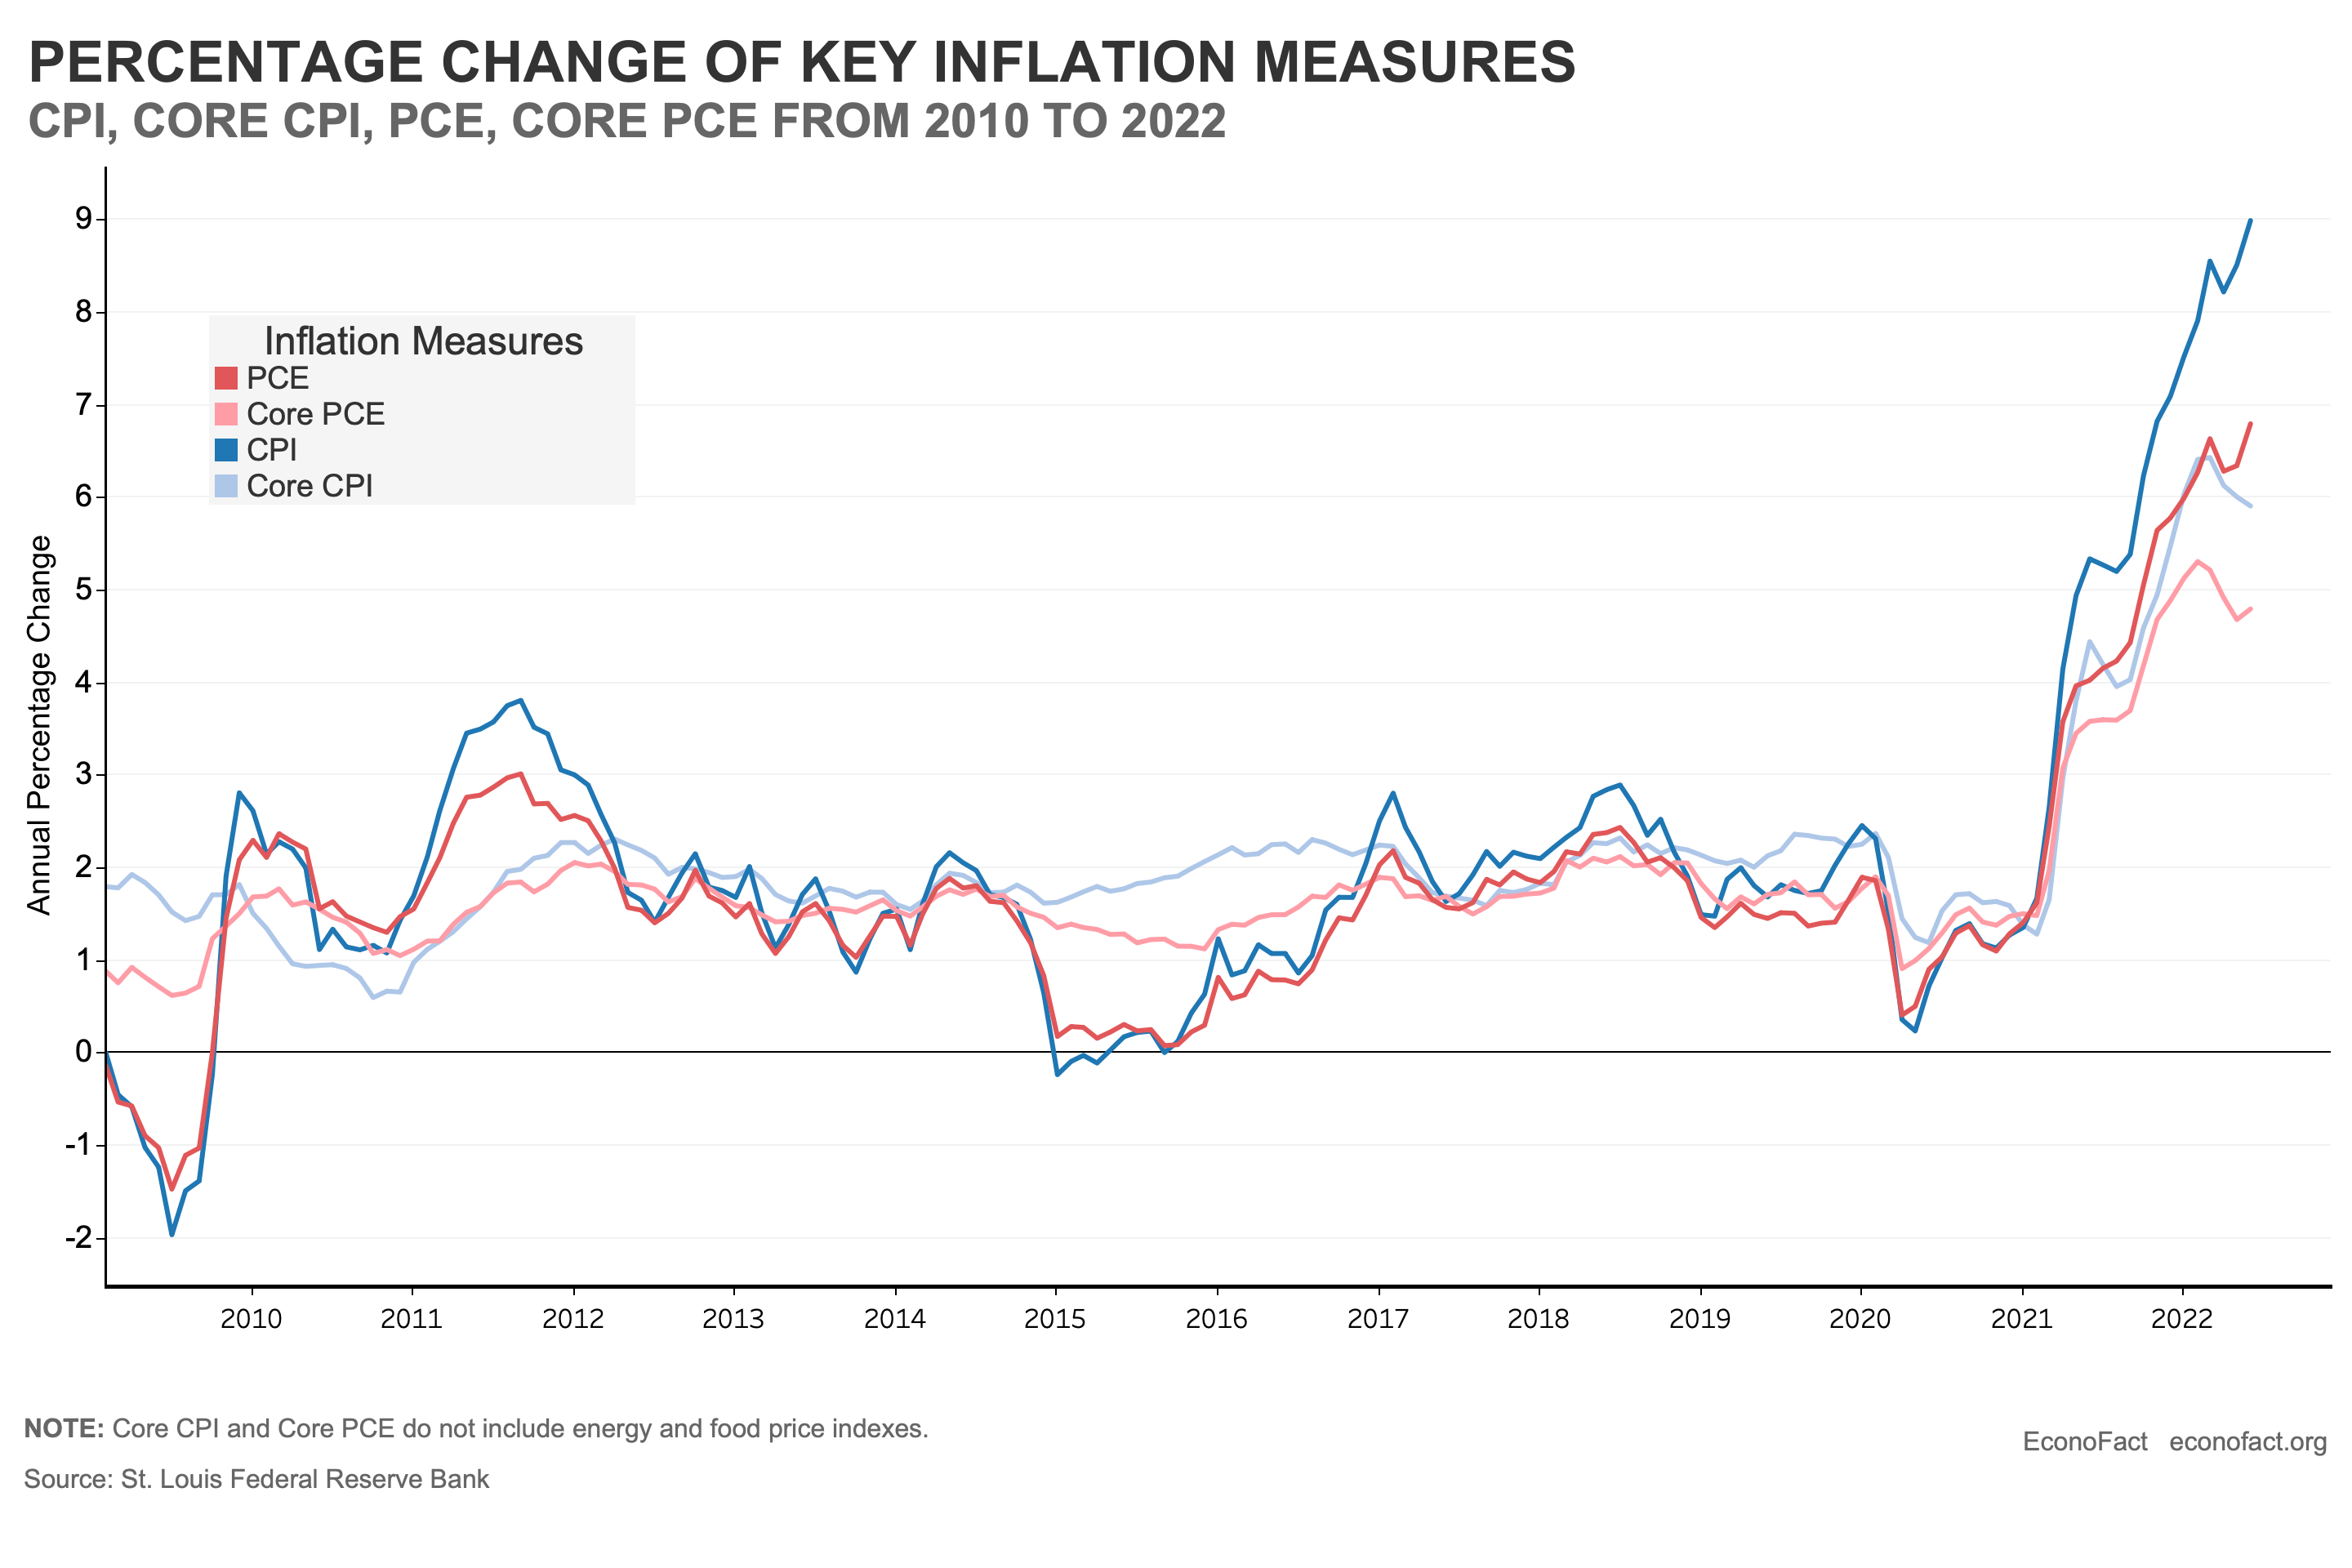
- The most widely watched and reported measure of inflation is the Consumer Price Index (CPI), compiled by the Bureau of Labor Statistics (BLS) in the Department of Labor. In June 2022, the headline CPI indicated that prices were 9.1 percent higher than a year earlier—a 40-year high. Inflation as measured by the CPI surged since the middle of last year — to rates well beyond what most forecasters had anticipated as the economy first emerged from the pandemic (see chart). Inflation was pushed higher by a perfect storm of factors — supply-chain disruptions, spending that ran ahead of the economy’s ability to produce goods and services fueled in part by considerable government stimulus, and shocks to food and energy prices related to the war in Ukraine. Versions of the CPI are used to index Social Security benefits, some wage contracts, and some U.S. government bonds. The CPI also is used more informally to gauge changes in the cost of living by households, businesses, analysts, and the media.
- By design, official measures of inflation like the CPI capture the experience of an “average” urban household, and many people experience higher or lower inflation than reported by published indexes. CPI inflation is calculated by combining information on price changes for many different goods and services with data on expenditure shares that reflect the importance or weight of each item in the “average” household’s overall spending as determined by a survey of consumers. For example, food has a weight of 13.4 percent, while shelter has a share of 32.3 percent. Because few households have spending patterns that match the average, most households experience an inflation rate that differs from the official measure. For example, food and housing generally make up a larger share of budgets of lower-income households. In times of relatively modest price changes for most items, these differences in weights have little effect on individual inflation rates. But, because prices of these items have surged recently, many lower-income households have seen higher inflation over the past year than have higher-income households. In addition to differences in expenditure shares, different households shop in different stores and this variation also can contribute to differences in realized inflation. Given the concerns raised by increases in income inequality, expanding the capacity to estimate price indexes defined by income quintile or decile is an important area for future research (see recent report by the National Academies of Sciences, Engineering, and Medicine). Other differences in expenditure shares can also be important, such as older households tending to spend more on medical care and only a subset of households paying college tuition.
- Because food and energy prices frequently are impacted by special factors — such as weather events or geopolitical instability — and can be quite volatile, analysts often focus on so-called core inflation, which gauges the rate of inflation for all items other than food and energy. In many circumstances when food and energy prices are jumping around, the core measure provides a better read on the underlying trend in inflation. With the war in Ukraine, energy prices surged 41.6 percent in June compared with a year earlier and food prices were up 10.4 percent. These big moves pushed up the headline CPI considerably. The core CPI — which excludes food and energy prices — rose 5.9 percent in June from a year earlier, but that rate was well below the 9.1% headline rate of inflation. While the headline CPI was continuing to increase in June, when prices of food and energy were increasing, the core rate was down from its peak earlier in the year (though it still remained at levels not seen since the early 1980s). At the same time, people need to purchase food and fuel on a regular basis while purchases of other items can be deferred, so the headline measure is important to understand how purchasing power is changing over time.
- While the CPI has the most salience with the public, the Federal Reserve prefers a different measure — the price index for personal consumption expenditures (PCE) —that provides a better gauge of overall price changes. This measure is compiled by the Bureau of Economic Analysis (BEA) in the Department of Commerce and is an input into BEA’s calculation of gross domestic product (GDP). The PCE index differs from the CPI in two important ways that make it a preferable measure. First, it uses a formula to combine (or aggregate) prices of different items that better captures shifts in buying patterns as consumers shift purchases away from items experiencing big price increases or toward items on sale. Second, it covers a wider set of items. The CPI focuses on expenditures by households, and it only tracks prices of items purchased directly by households (so-called out-of-pocket expenditures). Thus, for example, medical care provided by an employer is out of scope for the CPI. In contrast, the PCE price index tracks prices of all items consumed by households because that is the relevant concept for adding up to GDP. Accordingly, the PCE index would include employer-provided medical care. These differences in the aggregation formula and coverage are important reasons for the Federal Reserve’s preference for the PCE index.
- Given the differences between the measures, PCE and CPI inflation can differ by notable amounts. Indeed, the latest read on twelve-month PCE price inflation was 6.8 percent for the overall index and 4.8 percent for the core index, lower rates compared with the 9.1 percent headline CPI and 5.9 percent core CPI for the same period. One important reason for this difference is that the expenditure shares of food, energy, and housing are smaller in the PCE index than in the CPI because PCE includes items not in the CPI and that dilutes the share of other items.
- The Federal Reserve has a target for inflation of 2 percent for the overall PCE price index. On a PCE basis, current inflation readings are well above the Fed’s target (though not as far above as CPI inflation) and, accordingly, the Federal Reserve has been raising interest rates to slow the economy and reduce inflation. The basic mechanism is that higher interest rates are intended to tamp down spending. Effects will be felt especially in sectors for which borrowing often is involved to finance purchases, including housing, other large-consumer purchases such as cars, and business investment. Indeed, the housing sector appears already to be slowing. Reduced spending should, in time, bring overall demand back into balance with the economy’s ability to produce goods and services and that balance should lead to lower inflation.
What this Means:
By any measure, inflation has surged in the past 18 months with rates well above the Federal Reserve’s 2 percent target. Although the headline CPI has received the lion’s share of media attention, other inflation measures are important and serve different purposes. Key differences include what is covered by the index and how prices of different items are combined to construct an overall index. Moreover, some measures capture overall changes in the cost of living, while others focus more on the underlying trend in inflation. Another important aspect of official inflation measures is that they are designed to capture inflation for the “average” household, and most households’ inflation experience will differ from that reflected in official measures.
Like what you’re reading? Subscribe to EconoFact Premium for exclusive additional content, and invitations to Q&A’s with leading economists.