How Do Fertility Rates Affect US Fiscal Sustainability?
Federal Reserve Board and Aspen Economic Strategy Group
The Issue:
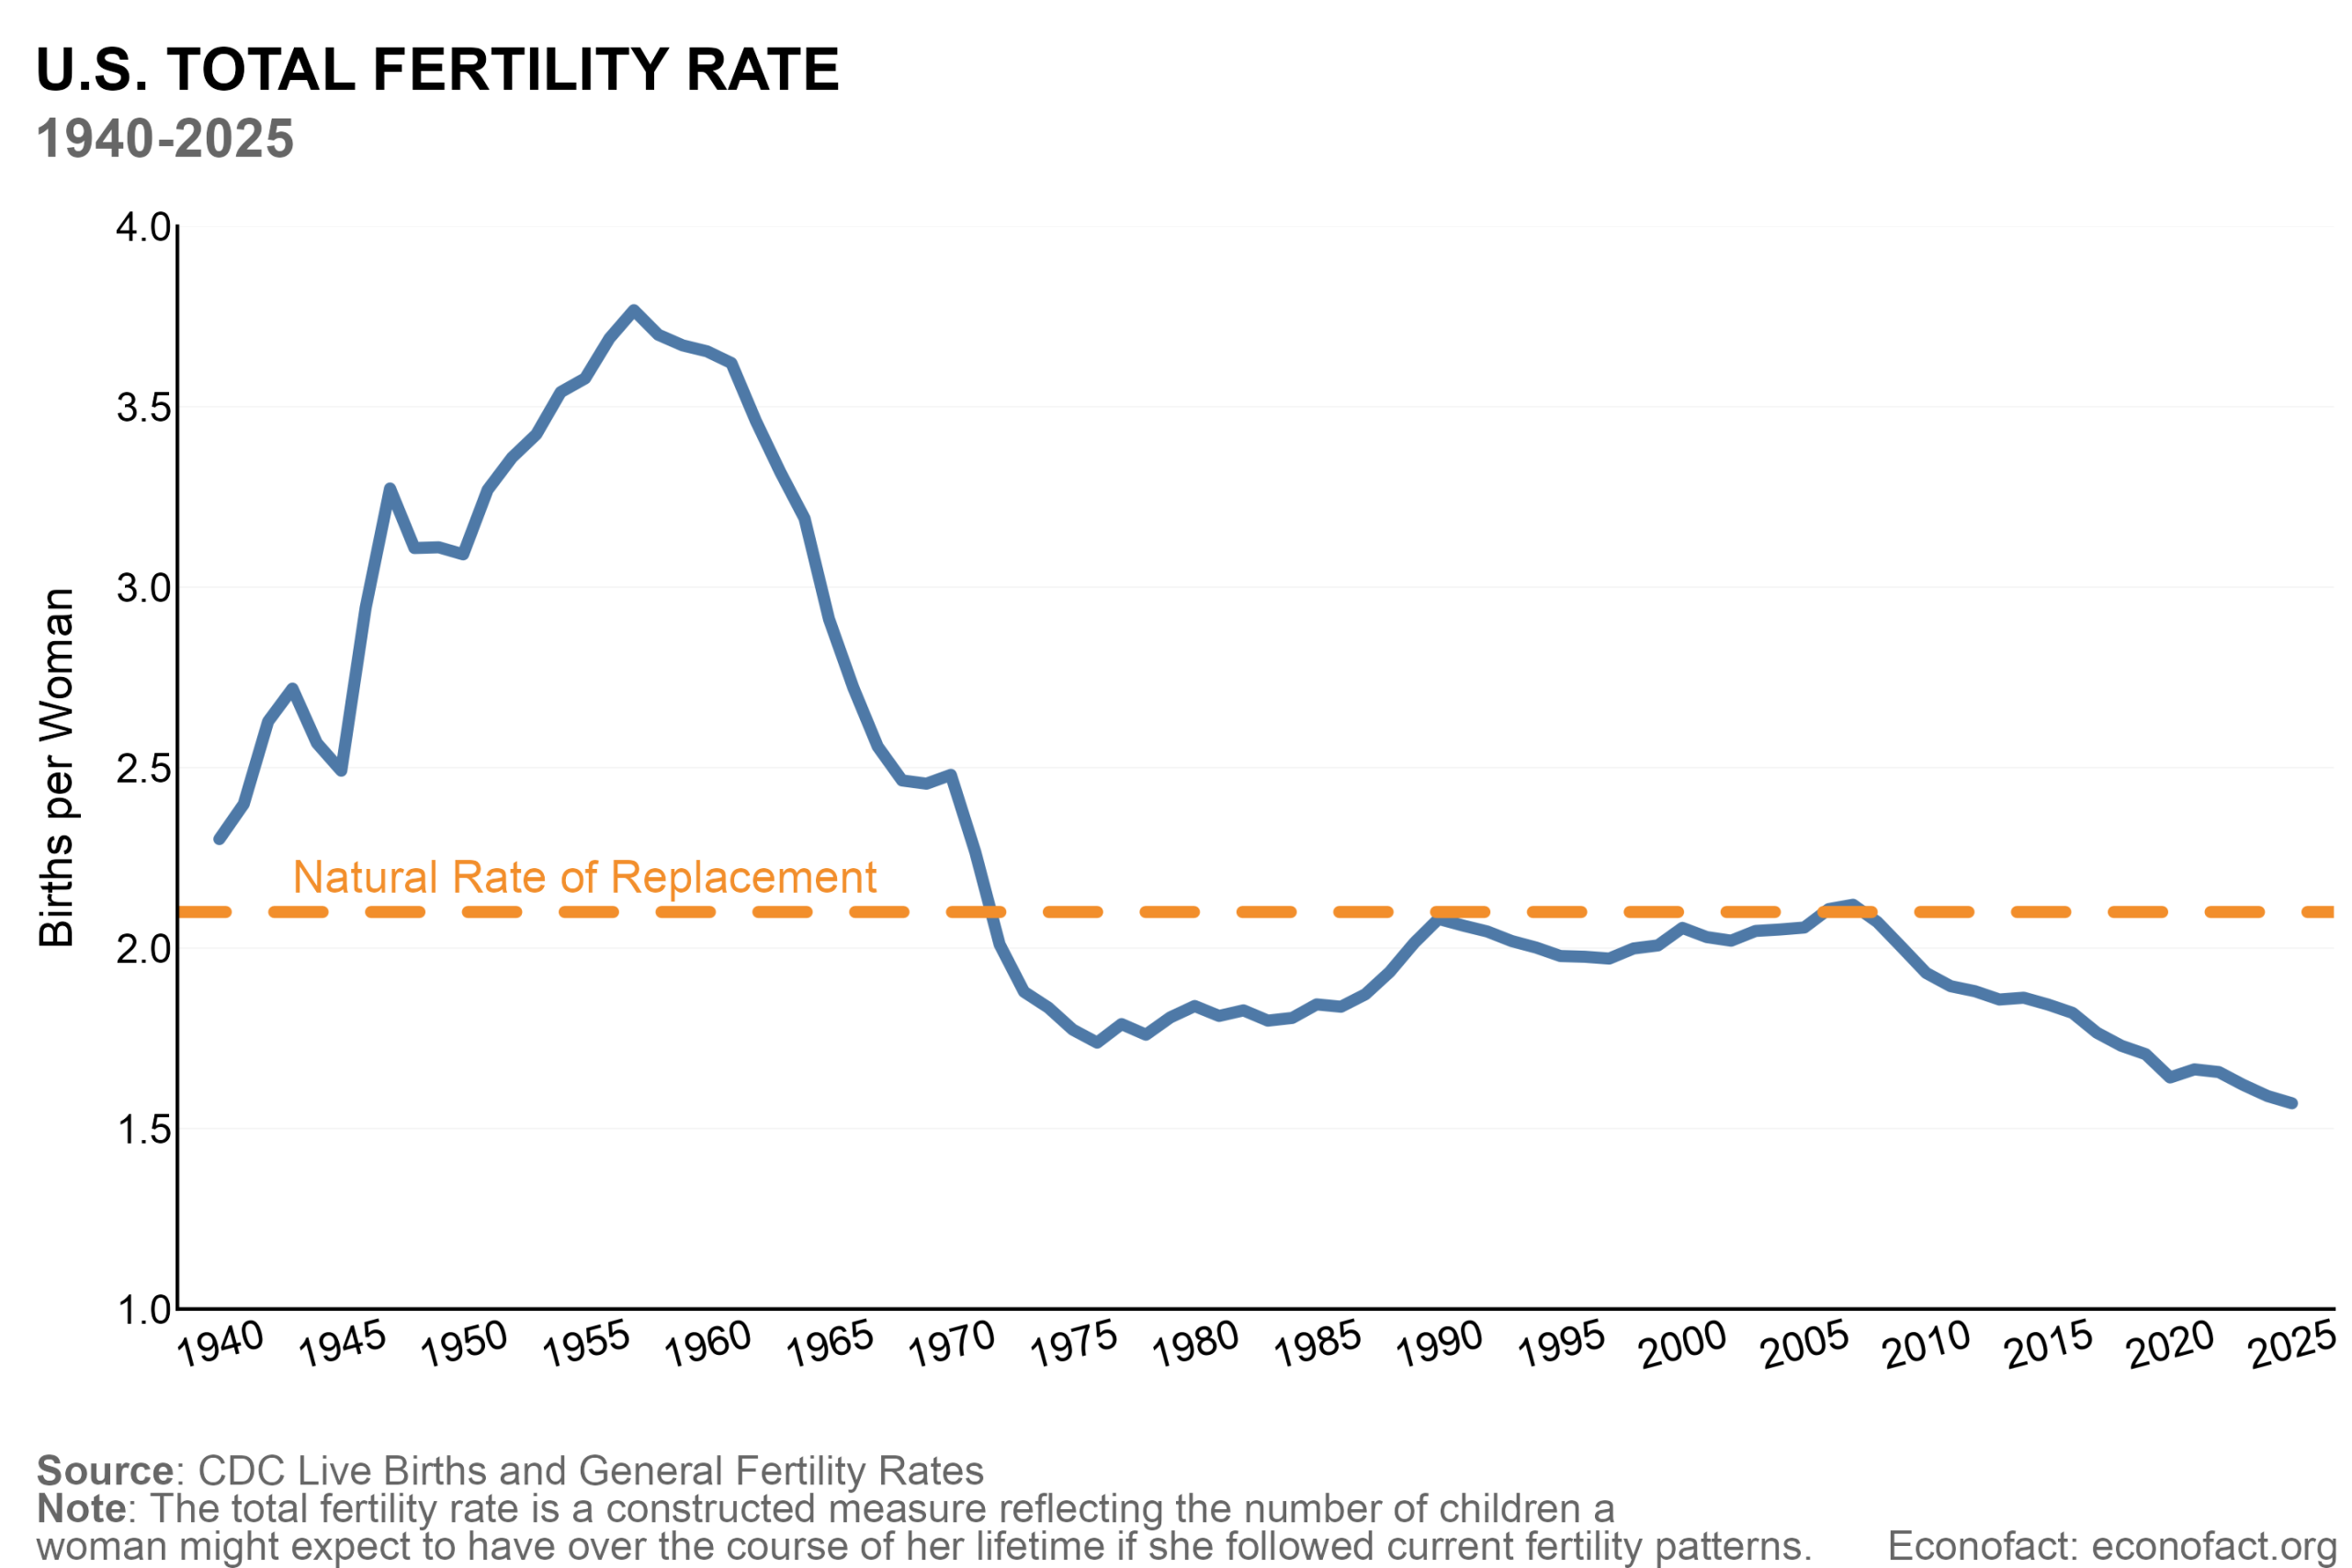
The U.S. birth rate, which has been dropping lower almost every year since the Great Recession, hit a record low in 2025 when the country’s total fertility rate dropped to 1.57 births per U.S. woman, well-below the level needed for the population to replace itself. All else being equal, a decreasing proportion of younger people increases the share of elderly dependents relative to the working-age population, lowering the government’s tax revenues and raising spending obligations. The U.S. federal government debt has reached levels not seen since the aftermath of World War II, and is projected to continue rising over the next three decades on an unsustainable path. How have past fertility trends contributed to the government’s spending and revenue and high federal debt? And what might the recent transition to below-replacement fertility mean for the future fiscal outlook?
Even if fertility rates were to suddenly return to replacement, the budget outlook over the next 30 years would worsen, not improve.
The Facts:
- The United States has experienced large shifts in fertility over the past 60 years. The total fertility rate (TFR), a constructed measure reflecting the number of children a woman might expect to have over the course of her lifetime if she followed current fertility patterns, rose sharply during the mid-twentieth-century Baby Boom, peaking at 3.8 births per woman in 1957. The total fertility rate then declined through the 1970s and held steady for several decades around the 2.1 level that is needed for populations to replace themselves across generations. Birth rates then began a sustained decline in 2007, with the TFR falling from 2.1 in 2007 to an estimated record low of 1.57 in 2025 — according to calculations based on the latest provisional data from the CDC.
- Fertility rates affect the federal budget because they affect dependency ratios. The dependency ratio is the number of dependents (children and the elderly) relative to the working-age population. The old-age dependency ratio is far more important for understanding federal budget trends than the child dependency ratio because federal spending on the elderly on a per capita basis is five times larger than federal spending on children. Higher dependency ratios mean more spending on programs that support dependents relative to tax revenue generated by the working-age population. A growing imbalance between spending on dependents and revenues leads to rising federal deficits.
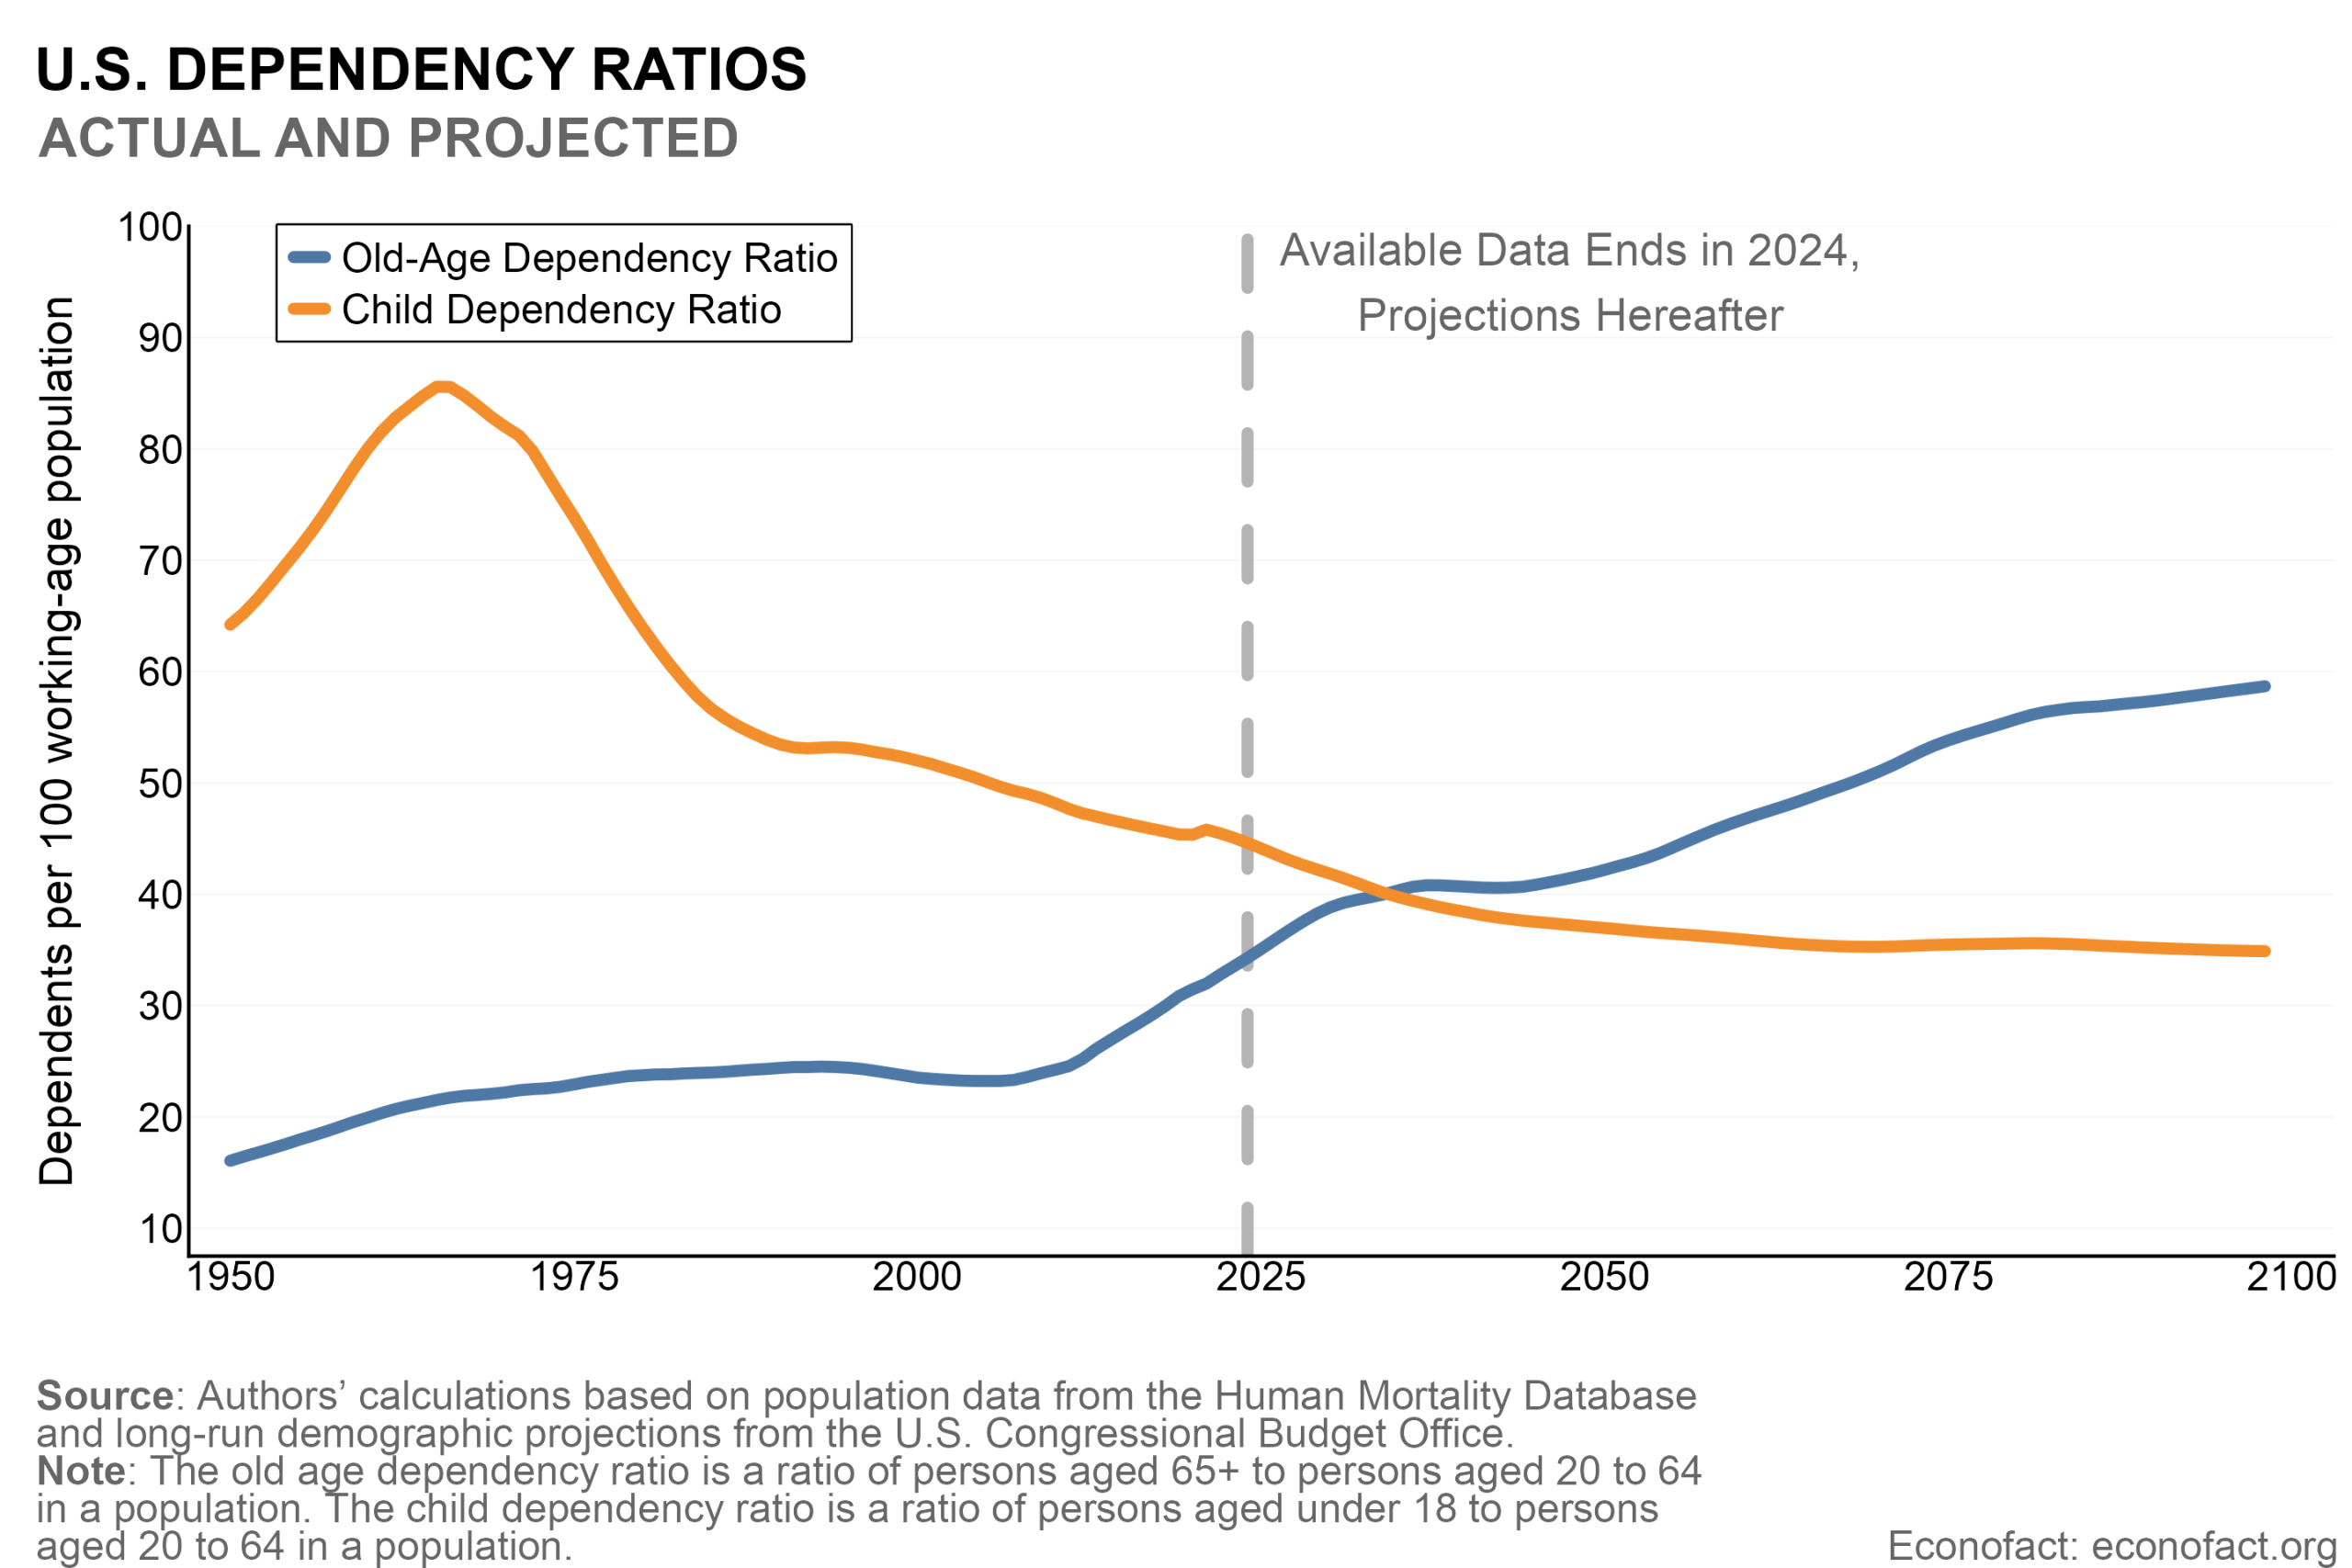
- The dramatic swings in fertility in the mid-twentieth century have led to rapidly rising old-age dependency ratios since the early 2000s — a key contributor to rising deficits and debt. As the baby boomer cohort aged into retirement, the share of the population eligible for Social Security and Medicare increased significantly relative to smaller, younger cohorts working and paying taxes. In 2000 there were about 24 people aged 65 and older for every 100 working-age adults. By 2025, the share of seniors had risen to about 35 for every 100 people aged 20-64 (see chart above). This shift led to a substantial rise in spending on old-age entitlement programs, which rose from 2.5% to 9% of GDP since the 1960s. Our recent research finds that if spending on these programs had remained at their 2000 level as a share of GDP, the primary deficit (the difference between government revenues and spending, excluding interest payments on government debt) would have been about 0.8 percent of GDP compared to its actual value of 3.3 percent of GDP in 2023.
- The projected increase in old-age dependency ratios is the source of the projected rise in the US federal debt over the next three decades. Old-age dependency ratios are expected to continue rising over the next three decades. During this period, the still relatively large cohorts born just after the baby boom will age into retirement and this, combined with longer life expectancies, mean higher payments to the elderly and rising federal debt. Current projections indicate that by 2040, the number of elderly dependents per 100 working-age people will rise to 41. If, instead, the old-age dependency ratio remained at its 2025 level and current tax and spending plans remained in place, we estimate that the government would have a primary budget surplus around 2040.
- Even if fertility rates were to suddenly return to replacement, the budget outlook over the next 30 years would worsen, not improve, and dramatically so if we factor in the costs of pronatalist policies that might be needed to achieve replacement fertility. A child born today will not join the workforce and pay taxes for about 20 years. Accordingly, higher fertility rates do not do much, mechanically, to lower old-age dependency ratios. Furthermore, a rise in fertility rates would lead to a rise in child dependency ratios, raising federal spending on children over the next thirty years. Overall, when we compare a scenario where fertility rates return to 2.1 to one where they remain below 1.6, we find that primary deficits will be 0.2-0.5 percent of GDP higher annually over the next thirty years under the higher-fertility scenario. Moreover, these estimates do not take into account any spending that the government would incur in policies aimed at reversing the fertility decline. Many countries have tried policies to promote higher birth rates — including cash incentives for having children, lowering the costs of childcare, improving parental leave, and subsidizing in vitro fertilization. But these measures can be very costly and have met varying degrees of success. The level of government spending, through incentives and transfer payments, necessary for the United States to return to 2.1 fertility would be between 250 billion and 1 trillion annually, according to one estimate. Spending on this scale would result in explosive growth in the federal debt.
- Over the very long run, higher fertility could improve the fiscal outlook by expanding the future tax base and easing pressure on age-related programs. However, these benefits materialize only gradually. For example, in the Social Security Administration’s projections, a scenario with replacement level fertility would begin to materially improve program finances compared to a scenario with continued low fertility after about 2075. The key question is whether changes in tax or spending policy would need to happen before the fiscal benefits of higher fertility are realized. While there is an ongoing debate about what level of debt is sustainable for the US to accumulate, it seems unlikely that higher fertility alone will resolve fiscal pressures without policy changes.
What this Means:
Past declines in fertility are an important driver of the secular increase in deficits and debt in recent decades. And rising old-age dependency ratios are expected to continue to exert pressure on the US fiscal situation for the next three decades. However, the long-run fiscal outlook will ultimately depend on a range of economic and policy factors. While demographic trends are putting upward pressure on deficits and debt, other forces could materially alter this trajectory. For example, higher immigration or faster productivity growth, potentially driven by technological advances such as AI, could expand the labor force and improve fiscal sustainability. Policy choices, including raising taxes or reforming old-age entitlement programs, would also play a central role in shaping long-run outcomes. In addition, the long-run projections from the Congressional Budget Office for economic growth, interest rates, and government spending used to conduct this analysis are highly uncertain and do not account for potential future economic shocks that could alter the fiscal trajectory.
Like what you’re reading? Subscribe to EconoFact Premium for exclusive additional content, and invitations to Q&A’s with leading economists.