Tracking the Pandemic’s Trajectory: COVID-19 Cases vs. Deaths in the U.S.
University of Michigan

The Issue:
When will the U.S. be able to lift social distancing restrictions and begin to restore its economy? Large policy decisions depend on understanding the scope of the COVID-19 outbreak, its likely trajectory, and the effectiveness of policies to control it. Yet the fast-moving pandemic presents challenges for measurement. The number of confirmed COVID-19 cases is commonly being used to gauge how severe an outbreak is in a particular country or region. How quickly confirmed cases are growing is also cited as a measure of how fast the disease is spreading. However, the number of confirmed cases of COVID-19 depends not just on how many people are sick, but also on the way in which testing is being carried out. Therefore, it is hard to tell how much of the growth reflects the spread of the disease versus increases in the use of testing. Could looking at the deaths caused by the disease provide us with a clearer picture?
Large policy decisions depend on understanding the scope of the COVID-19 outbreak, its likely trajectory, and the effectiveness of policies to control it.
The Facts:
- Getting correct estimates of the growth rate of COVID-19 is crucial to forecast what happens next. The total number of COVID-19 deaths in the US recently passed 1000, which remains small relative to the almost 3 million deaths that the country experiences in a typical year. Nevertheless, this new virus is exhibiting exponential growth, meaning that its impact could potentially double in a short stretch of time, then double again in a similarly short stretch of time, and so forth. Therefore, the growth rate is key to understanding the eventual toll of the disease. The contrast in the very different trajectories of the coronavirus pandemic in Italy and South Korea provides a clear example of how much outcomes can differ and how much this matters. The first two confirmed cases in Italy appeared between the end of January and the beginning of February. The number of confirmed COVID-19 cases in Italy surpassed 74,000 and had led to 7,503 deaths — more than double the number of deaths in Hubei, China, where the pandemic originated — as of March 25, according to the Johns Hopkins Coronavirus Resource Center. South Korea confirmed its first case before Italy, on January 21 — the same day that the U.S. confirmed its first case. While the epidemic had an explosive start in South Korea, rapidly climbing into the thousands, the number of new cases found each week began to shrink starting in March. As of March 25, South Korea had seen just over 9,000 confirmed cases and a total of 126 deaths.
- Knowing how fast the disease is spreading — its growth rate — would help us to understand whether social distancing and other policies are starting to flatten the curve. In the absence of an approved treatment or of a proven vaccine, the main strategy that many countries have implemented to address the coronavirus pandemic has been to try to slow the rate of contagion — also referred to as "flattening the curve" — such that case growth does not overwhelm a community's available medical resources. The measures taken to slow the rate of contagion in the United States have varied over time and from state to state, and include closing schools and non-essential businesses, cancelling events, and shutting down major parts of the economy. The high costs of these measures to businesses and individuals increase as the length of the shutdowns is extended. Having information about changes to the growth rate of infection would make it possible to assess whether the measures are working and for how long they are needed.
- While a large, random sample testing for infection at various points in time would be the gold standard of epidemiological measurement, the current limited capacity for testing makes this impossible. Instead, it has been common recently to rely on reports of confirmed cases. In recent weeks the number of confirmed cases of COVID-19 in the U.S. has been growing at something like one third per day. In other words, each new day sees another 33 percent more confirmed cases than reported the day before. Because growth rates work like compounded interest, this implies a doubling of cases about every 2 days. It also puts the U.S. on a trajectory alarmingly similar to Italy's, as has been observed by various experts. But, relying on confirmed cases is problematic. As has been reported extensively in the news, the COVID-19 tests are scarce, and therefore used sparingly and selectively. COVID-19 infection apparently exhibits a wide range of severity from mild to lethal, with little consistency as to what level of severity triggers a test. There also appear to be differences in the extent of testing across different countries and even over time within the same country. Recently U.S. politicians and public servants have cautioned that growth in cases was in part being driven by a ramp-up in testing. After growing at a rate of about 10 per day for instance, confirmed cases in the state of Michigan went from 80 to 334 in 24 hours when testing capabilities expanded on March 19. In contrast, Los Angeles and New York City recently announced a new policy that would avoid testing patients except in cases when the result would change the course of treatment in order to maintain a supply of testing and protective equipment. Such limited testing would likely lead to under-counting total cases.
- Looking at the number of deaths from COVID-19 provides an alternative measure. If a given percentage of people who contract COVID-19 die, then the number of deaths should grow at the same rate as the number of cases, but with a time lag. The progression of the disease implies that most deaths would occur only after several weeks after infection, and therefore mortality is a somewhat dated picture of the infection rate. It is also likely that some COVID-19 mortality is misclassified into some other cause of death, especially when the disease first arrives in an area. Yet there can be little doubt that death is a severe outcome, so the issue of the variable threshold for severity that contaminated the measurement of cases is less relevant here. A person who dies will be noticed by public-health authorities, who will search for cause of death. There may be no such search for everyone who is infected, especially for those with moderate symptoms. So, measuring COVID-19 mortality has certain advantages for understanding the trajectory of the disease.
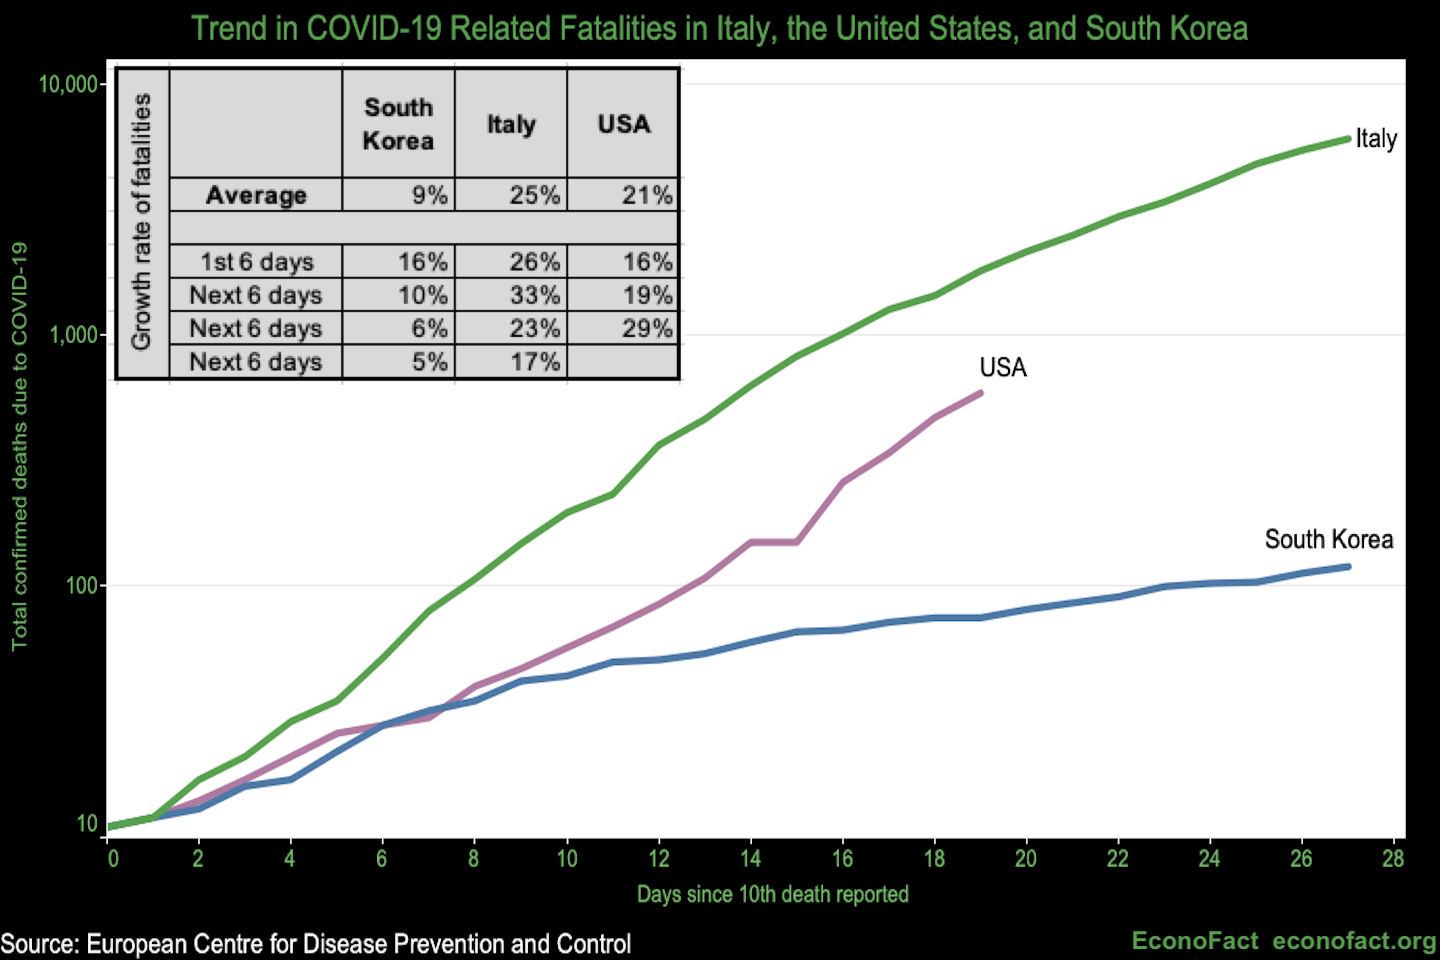
- The growth rate for deaths from COVID-19 in the U.S. is lower than the growth rate estimated from confirmed cases, but nonetheless puts the U.S. in a trajectory that is more similar to Italy than to South Korea. Since March 4th, COVID-19 deaths in the U.S. have grown by around 21% per day. This is lower than the confirmed-case growth of over 33% per day. Nevertheless, this reflects that deaths are doubling every 3 1/3 days. The chart above displays total (cumulative) COVID-19 deaths for three countries: the USA, Italy, and South Korea. The series are re-aligned to start when a country first reports at least 10 COVID-19 deaths. From the beginning, Italy experienced faster growth than Korea in COVID-19 mortality. This led to a rapid divergence between the two countries. The U.S. trajectory lies somewhere between Italy and South Korea. A reduction in the growth rate over time would flatten the curve. Korea was able to partially flatten its curve, with growth rates dropping from 16% per day at the outset to 5% more recently. Italy's curve actually steepened early on, and has flattened since then. The curve for measured COVID-19 deaths in the U.S. is steepening rather than flattening. The U.S. trajectory started like Korea’s, but the U.S. growth rate has since accelerated to be more like Italy’s. (If we realign and re-cut the series to start at similar deaths per capita — to take into account the much larger size of the population in the U.S. relative to the other two countries — the U.S. starts off on the Italian trajectory.)
- Up to this point different parts of the U.S. have had very different experiences, with most deaths concentrated in three hotspots growing at different rates. However, the virus is spreading widely across the country, so a large share of the mortality numbers is also coming from areas recording their first deaths (see top chart). The state of Washington had one of the first COVID-19 deaths and reached ten recorded deaths by March 3. The growth rate of deaths there has been around 12% per day (a doubling time of almost 6 days) since then. California recorded its first death on the same day as Washington State, yet took almost 2 more weeks than Washington to reach 10 deaths. After that, California has grown at about 18% per day. The principal states in the area of New York City (New York, New Jersey, and Connecticut) have seen 38% daily growth in their combined COVID-19 mortality since reporting the first ten deaths, and will likely surpass Washington State's COVID-19 deaths per capita in the near future. While our attention is naturally drawn to these hotspots, the rest of the country is hardly unaffected. COVID-19 mortality in the remaining states passed ten COVID-19 deaths in mid-March and have seen a 36% daily growth rate since then. Additionally, the number of counties reporting at least one death has grown by 20% per day throughout the time since the first COVID-19 death was recorded. (Sources: author's calculation using flutracker.com.)
What this Means:
Currently both cases and mortality are problematic for the measurement of COVID-19: cases because of an ill-defined definition of severity and a lack of adequate testing and deaths because of a time lag between infection and mortality. Ideally, we would like to have large random samples of tests for infection and for antibodies. But, in the meantime, creative approaches to measurement of the growth rate, made with full awareness of the pros and cons of each measure, help shine more light on the enormously consequential decisions currently being made on the basis of less than ideal information. The analysis presented here suggests that the United States is currently on a trajectory somewhere between those of South Korea and Italy, probably closer to the Italian path at this point. Italy took over three weeks to bring its mortality growth rate down to near the (already alarmingly high) peak growth rate seen by South Korea, and Italy experienced nearly ten thousand deaths in the process.
Like what you’re reading? Subscribe to EconoFact Premium for exclusive additional content, and invitations to Q&A’s with leading economists.