Understanding and Measuring Uncertainty
Stanford University
 The Issue:
Many economic decisions involve a guess about the future: people’s decisions about purchasing houses or big-ticket items; companies’ choices about when and where to build new factories, whether to invest in capital equipment and how many workers to hire; and governments’ choices about spending and tax policies, among others. Uncertainty about the future can cause these transactions to be deferred or foregone. Thus, an understanding of uncertainty is important for an understanding of many economic outcomes. What are different types of uncertainty? How can uncertainty be measured? Are there times when uncertainty is higher? Are there places where there are systematically greater levels of uncertainty?
While uncertainty is inherently unobservable, researchers have found ways to gauge its level.
The Facts:
- One can consider two types of uncertainty: risk and ambiguity. This distinction was made by Professor Frank Knight of the University of Chicago in his 1921 book "Risk, Uncertainty and Profit". He identified risk as occurring when the range of potential outcomes, and the likelihood of each, is well known – for example, a flipped coin has an equal chance of coming up heads or tails. One could answer a question like “How many times would you expect a coin to come up heads if it is tossed 100 times?” with both a best guess (50) and a “confidence interval” (for example, in this case there is about a 95 percent chance that a fair coin will come up heads between 40 and 60 times). In contrast, what has become known as “Knightian uncertainty” or “ambiguity” arises when the distribution of outcomes is unknown, such as when the question is very broad or when it refers to a rare or novel event. At the outset of the COVID-19 pandemic, for example, there was a tremendous spike in Knightian uncertainty. Because this was a novel coronavirus, and pandemics are not frequent events, it was very difficult to assess likely impacts or predict the number of deaths with a high degree of confidence.
- While uncertainty is inherently unobservable, researchers have found ways to gauge its level. There are three broad groups of measures. One set is from financial markets. Asset prices reflect beliefs about the future so asset price volatility, or information gleaned from more sophisticated financial instruments, can serve as proxies for uncertainty. A second set of measures of uncertainty draws on survey data. Questions asked in some of these surveys tend to be qualitative (e.g. the survey may ask "How uncertain are you right now? Low, medium, high, or very high?"). Other surveys may ask managers to assign probabilities to different levels of their company’s future sales, which offers insights into the degree of agreement among them regarding future expectations. A third set of measures looks at the frequency of words reflecting uncertainty in newspapers. One example of this uses reports from the Economist Intelligence Unit, which appear monthly and cover about 140 countries. The reports have a very standardized structure which allows for cross-country comparisons in a manner that is not available with, say, scraping information from newspapers since newspapers differ markedly across countries. Overall, indicators of uncertainty tend to track each other. But they are not always aligned. For instance, after president Trump was elected in 2016, uncertainty measures derived from the use of the word uncertainty in news reports showed a much larger spike than those that were based on financial market volatility. In reverse, the Global Financial Crisis in 2008 showed a larger rise in stock-market measured uncertainty than newspaper discussions of economic uncertainty.
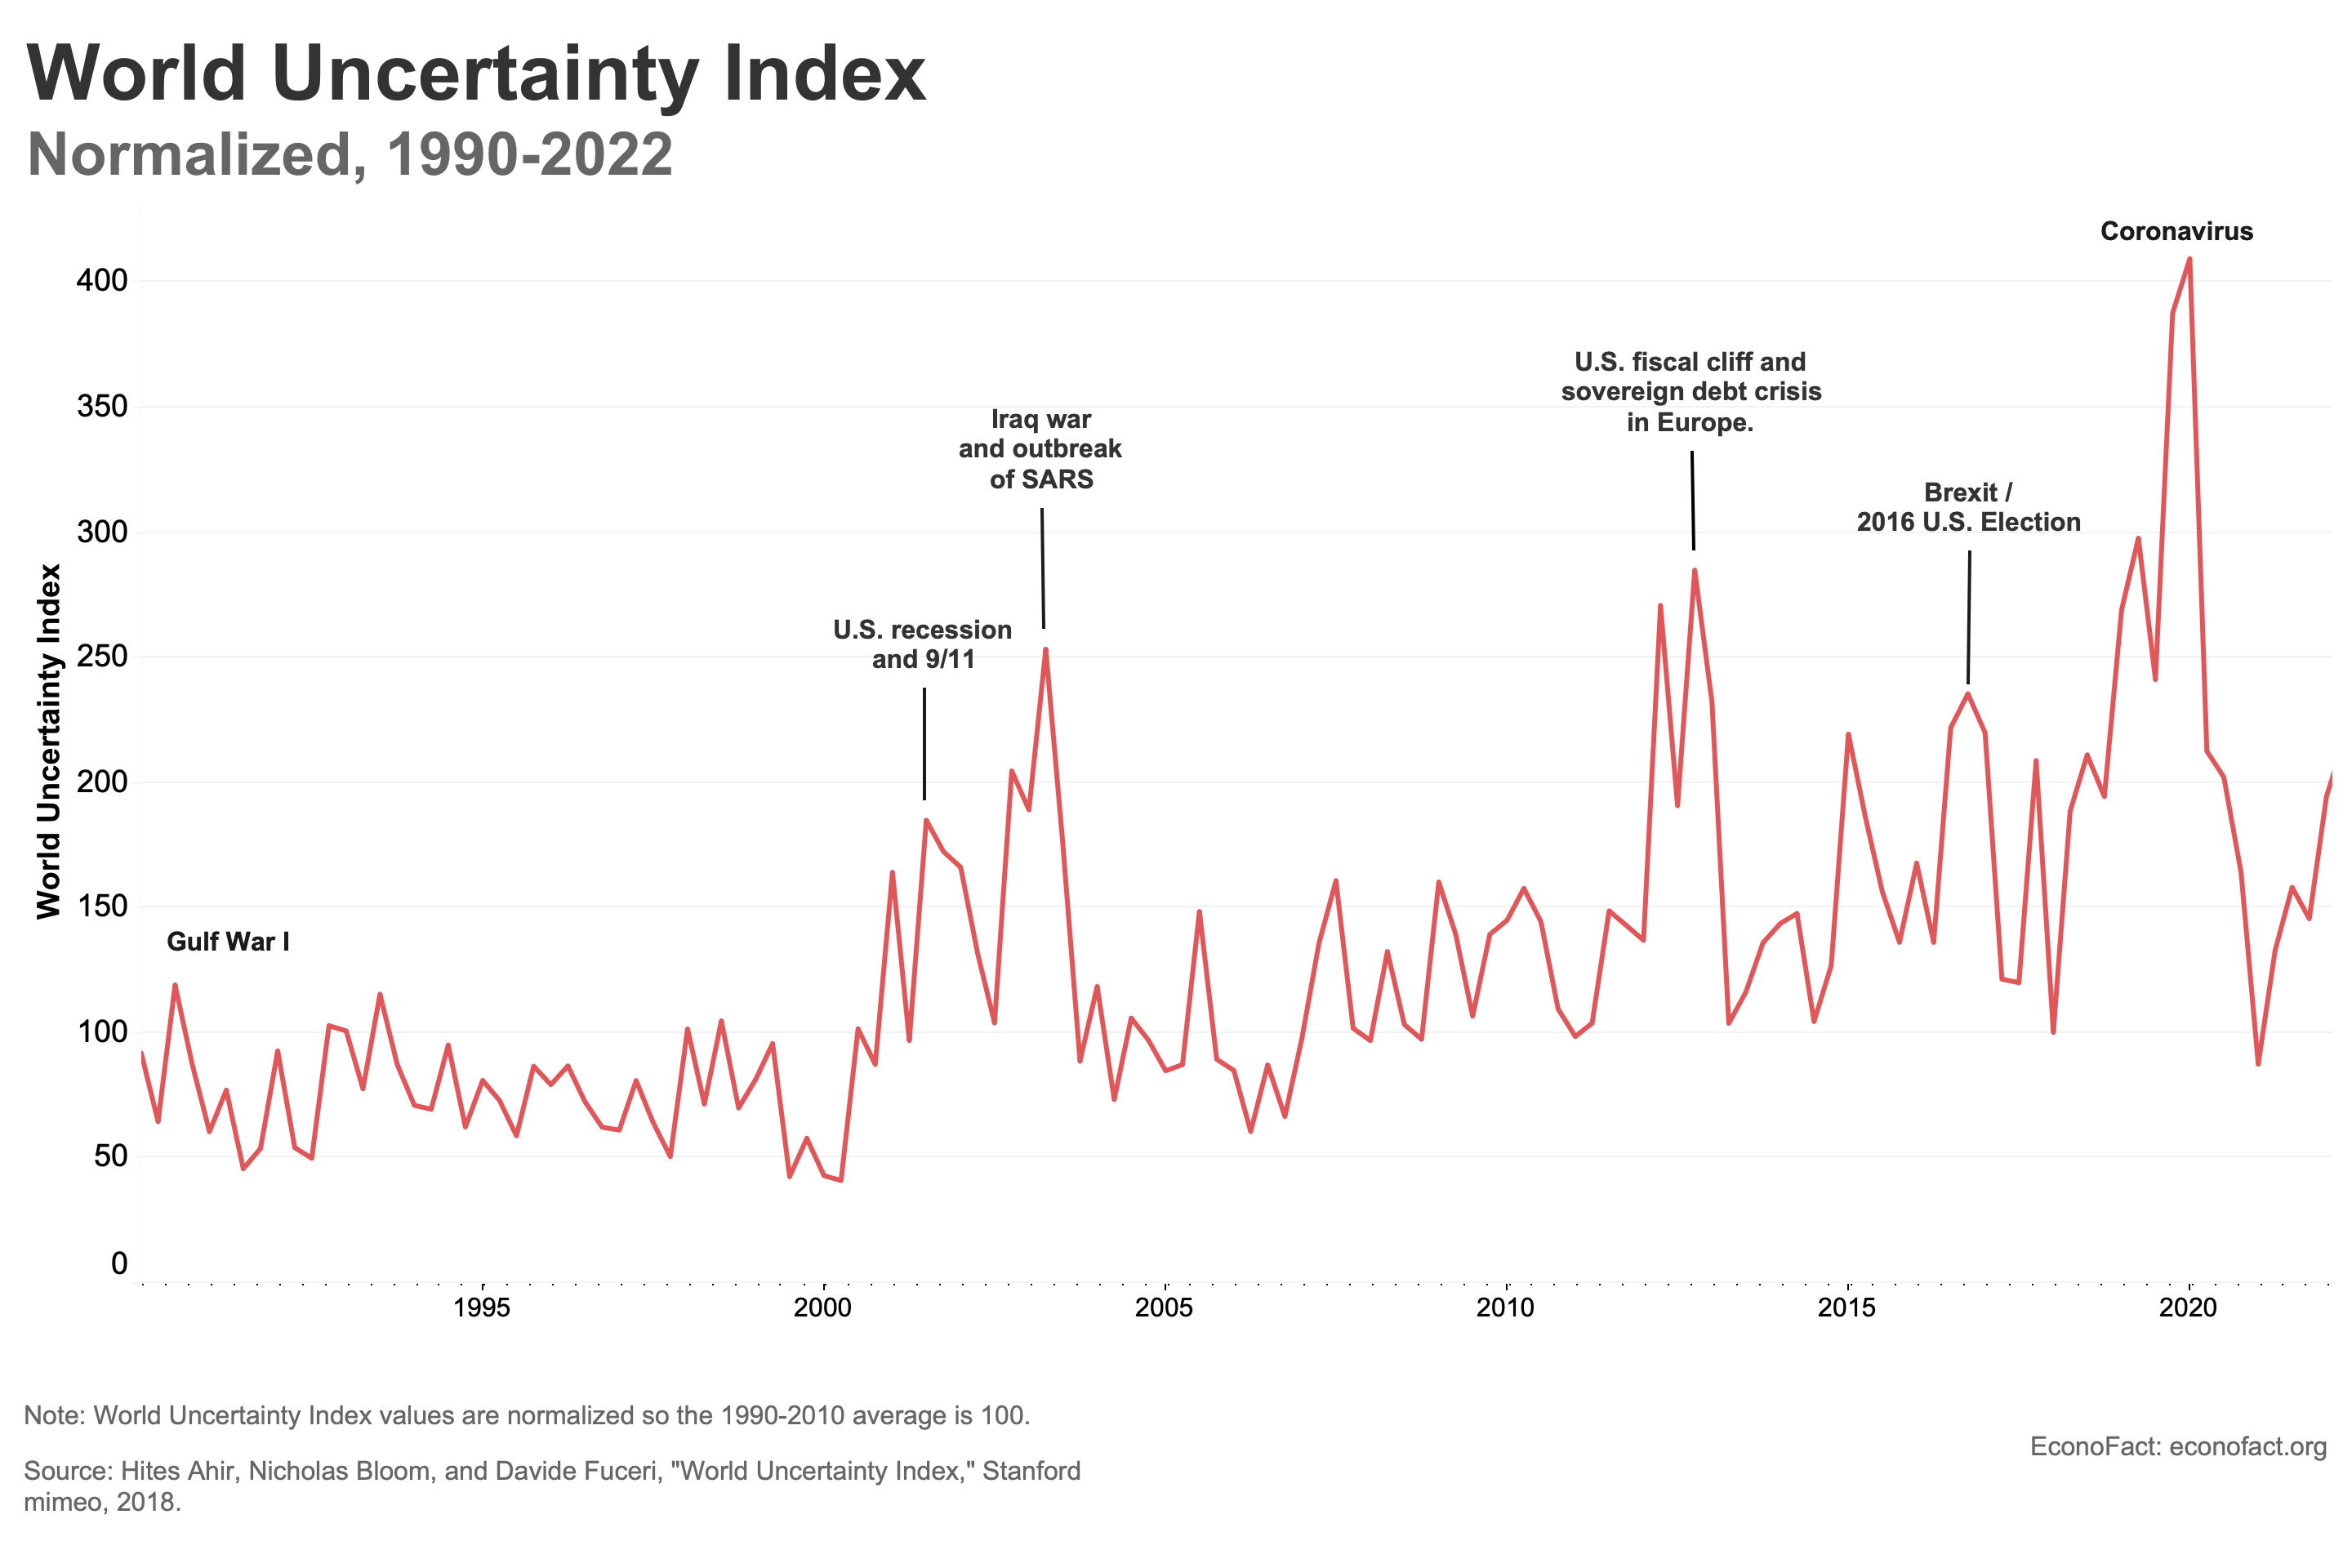
- Indicators of uncertainty mostly track risk but for episodes where these indicators spike they seem to also reflect ambiguity. The Economic Policy Uncertainty Index, which spans many decades and comes from U.S. newspapers, is one measure of uncertainty that allows us to observe trends over time. Uncertainty captured by this measure has roughly doubled for the global index since 2000, driven by a combination of global financial crisis, political shocks like the Brexit vote and the election of president Trump, and more recently the global pandemic. Another long run indicator is the frequency of the word uncertainty in the monthly reports from the Economist Intelligence Unit, which has also more than doubled since the year 2000 (see chart). The smaller peaks and valleys in these series reflect events like government policy announcements, companies reporting unexpected changes in earnings, or unusual price changes in important commodities like oil. These uncertainty series are also marked by big spikes that occur at the time of major geopolitical, economic, and other significant events like 9/11, the 2008 Global Financial Crisis, the onset of COVID and the invasion of Ukraine. These spikes occurring at the time of rare or atypical events may reflect more ambiguity or Knightian uncertainty.
- The Economist Intelligence Unit indicator shows higher levels of uncertainty in developing countries than in richer countries, and also higher levels in autocracies than in democracies. These reports reflect a higher frequency of policy uncertainty, conflict, political instability and impact of foreign events in poorer countries than in middle-income countries, with the lowest frequency of these factors in the richest countries. Autocracies also show higher levels of uncertainty than democracies because policies in these countries can be whipsawed by the whims of the leadership. Economic events in poorer countries and in autocracies react more strongly to a given increase in uncertainty, probably because of the lack of a robust financial sector that can provide bridge financing in downturns, and the relative absence of countercyclical policies and a strong social safety net (see here).
- Uncertainty and economic weakness can feed off of one another to create a vicious cycle that deepens downturns. In his 1936 book "The General Theory of Employment, Interest and Money", John Maynard Keynes attributed the collapse in business investment at the outset of the Great Depression to fear and uncertainty in the wake of the collapse of the stock market and bank failures. This, in turn, led to greater uncertainty as the economy cratered. Research by Christina Romer shows that there was a huge drop in spending on durable goods like cars and household equipment during the Great Depression, reflecting people’s reticence to make purchases that could be deferred when uncertainty was so high. But the role of uncertainty on the economy is not only an artifact of the 1930s. Recent theoretical and empirical research analyses show that higher risk and uncertainty can be linked to more recent recessions as well.
What this Means:
In a speech given in January 2020 Kristalina Georgieva, the Managing Director of the International Monetary Fund, said "if I had to identify a theme at the outset of the new decade, it would be increasing uncertainty," and she has continued to cite the “exceptionally uncertain” environment since then. Uncertainty has been shown to adversely affect economic outcomes. But there are steps people can take to insulate themselves, at least to some extent. One is to opt for more flexibility, such as leasing rather than buying, even if this comes at a cost. A second is to plan for different scenarios to offer at least a rough idea of how to respond to a range of outcomes. A third is to pay attention to politics – one estimate is that governments generate about one-third of measured uncertainty.
Like what you’re reading? Subscribe to EconoFact Premium for exclusive additional content, and invitations to Q&A’s with leading economists.