How Does the U.S. Tax System Stack Up?
Independent Economic Consultant
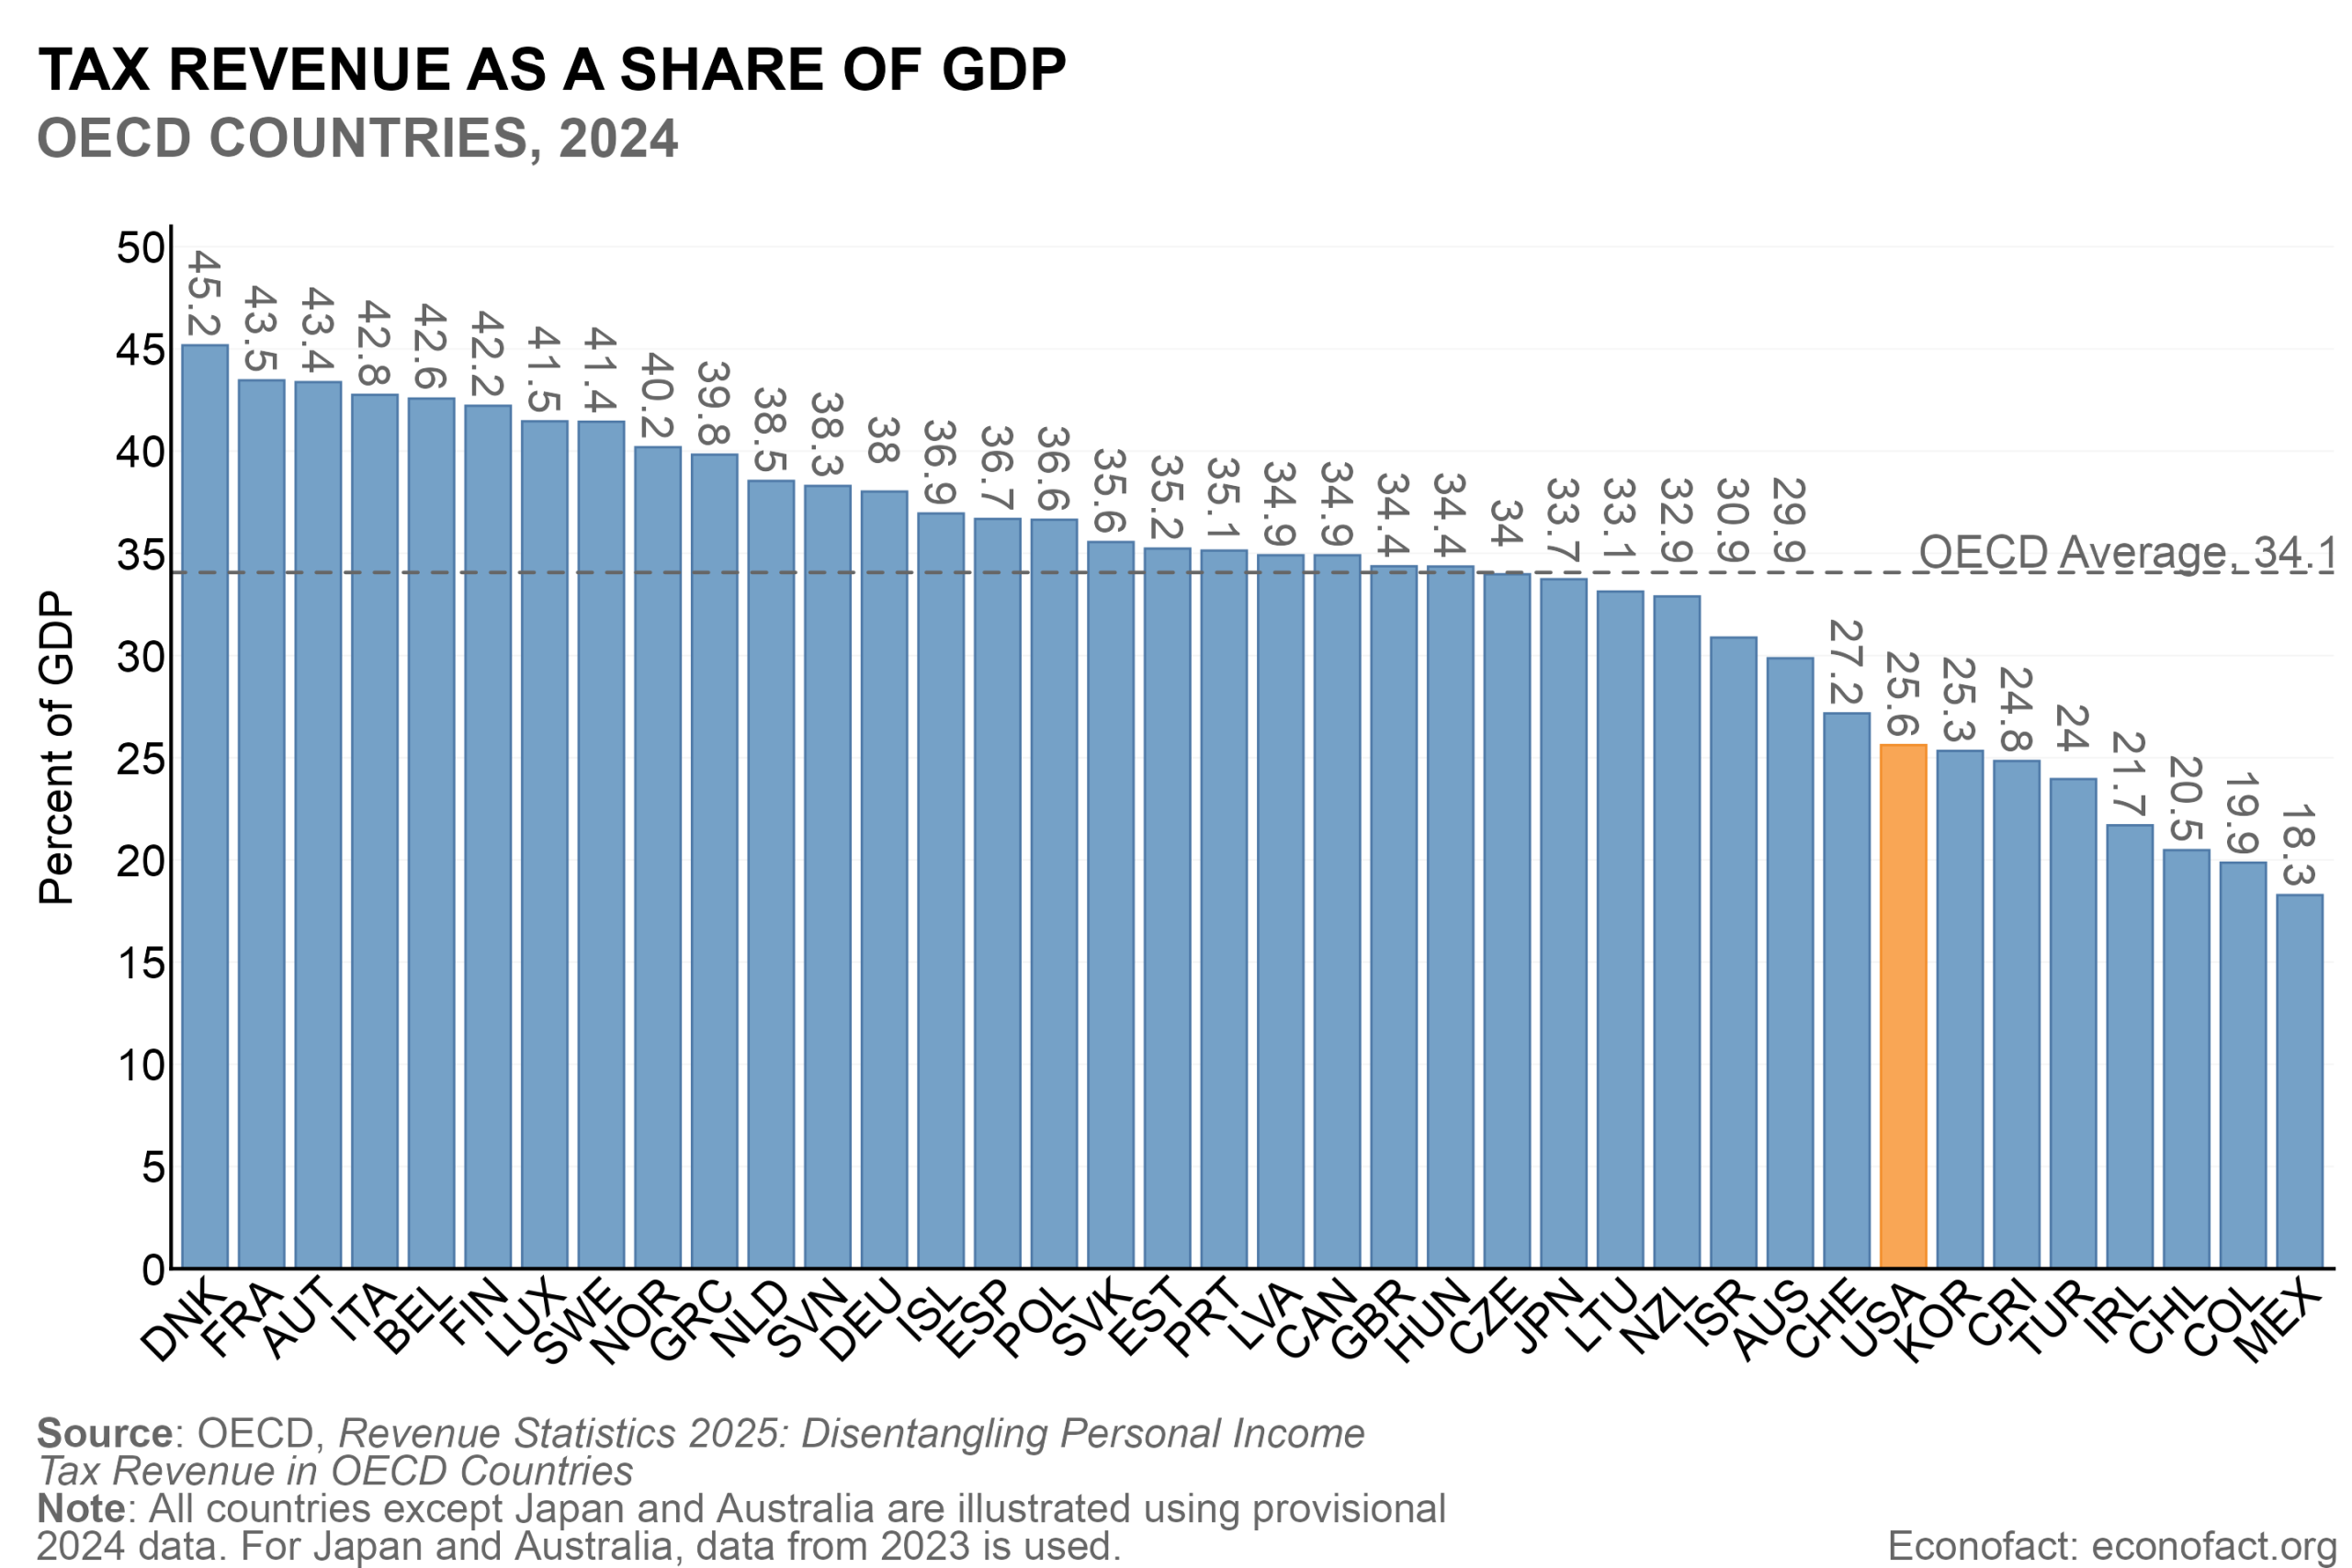
Click here for data on all OECD countries.
The Issue:
U.S. taxes, including those levied by state and local governments, are low compared with most other industrial countries. Moreover, U.S. tax revenues fall well short of public spending (which is also modest by international standards), resulting in large fiscal deficits and growing government debt as a share of GDP that is on track to surpass the record levels reached in the aftermath of World War II. In spite of numerous reform efforts, including over 30 separate packages at the federal level in the post-war period, general government tax revenue has remained largely unchanged as a share of GDP. Moreover, there remains considerable dissatisfaction with U.S. taxes, which voters view as too high, unfair, and overly complex. This memo provides perspectives on these issues by comparing the U.S. tax system to other OECD countries.
U.S. tax revenues fall well short of public spending. Reforms could help close the gap and improve the growth-friendliness of the system
The Facts:
- The U.S. tax system is relatively decentralized compared with many other countries, reflecting the responsibilities allocated by the U.S. Constitution. Only about two thirds of total tax revenues in the United States are collected at the federal level, a share that is about 10 percentage points lower on average than in other industrial-country federations and almost 25 percentage points lower than in other industrial countries with unitary tax systems (see here). Both the federal government and the states are empowered to levy taxes on personal and corporate income, as well as on the transfer of property upon death (“estate taxes”). Taxes on imports are reserved for the federal government, and property and sales taxes are the responsibility of the states. Both levels of government levy excise taxes, which are imposed on specific goods like tobacco, alcohol, or gasoline. In 2024, federal tax receipts totaled the equivalent of 17 percent of GDP, with the bulk derived from personal income taxes and social security contributions. State and local government tax receipts totaled the equivalent of 8½ percent of GDP, with roughly three quarters coming from property and sales taxes.
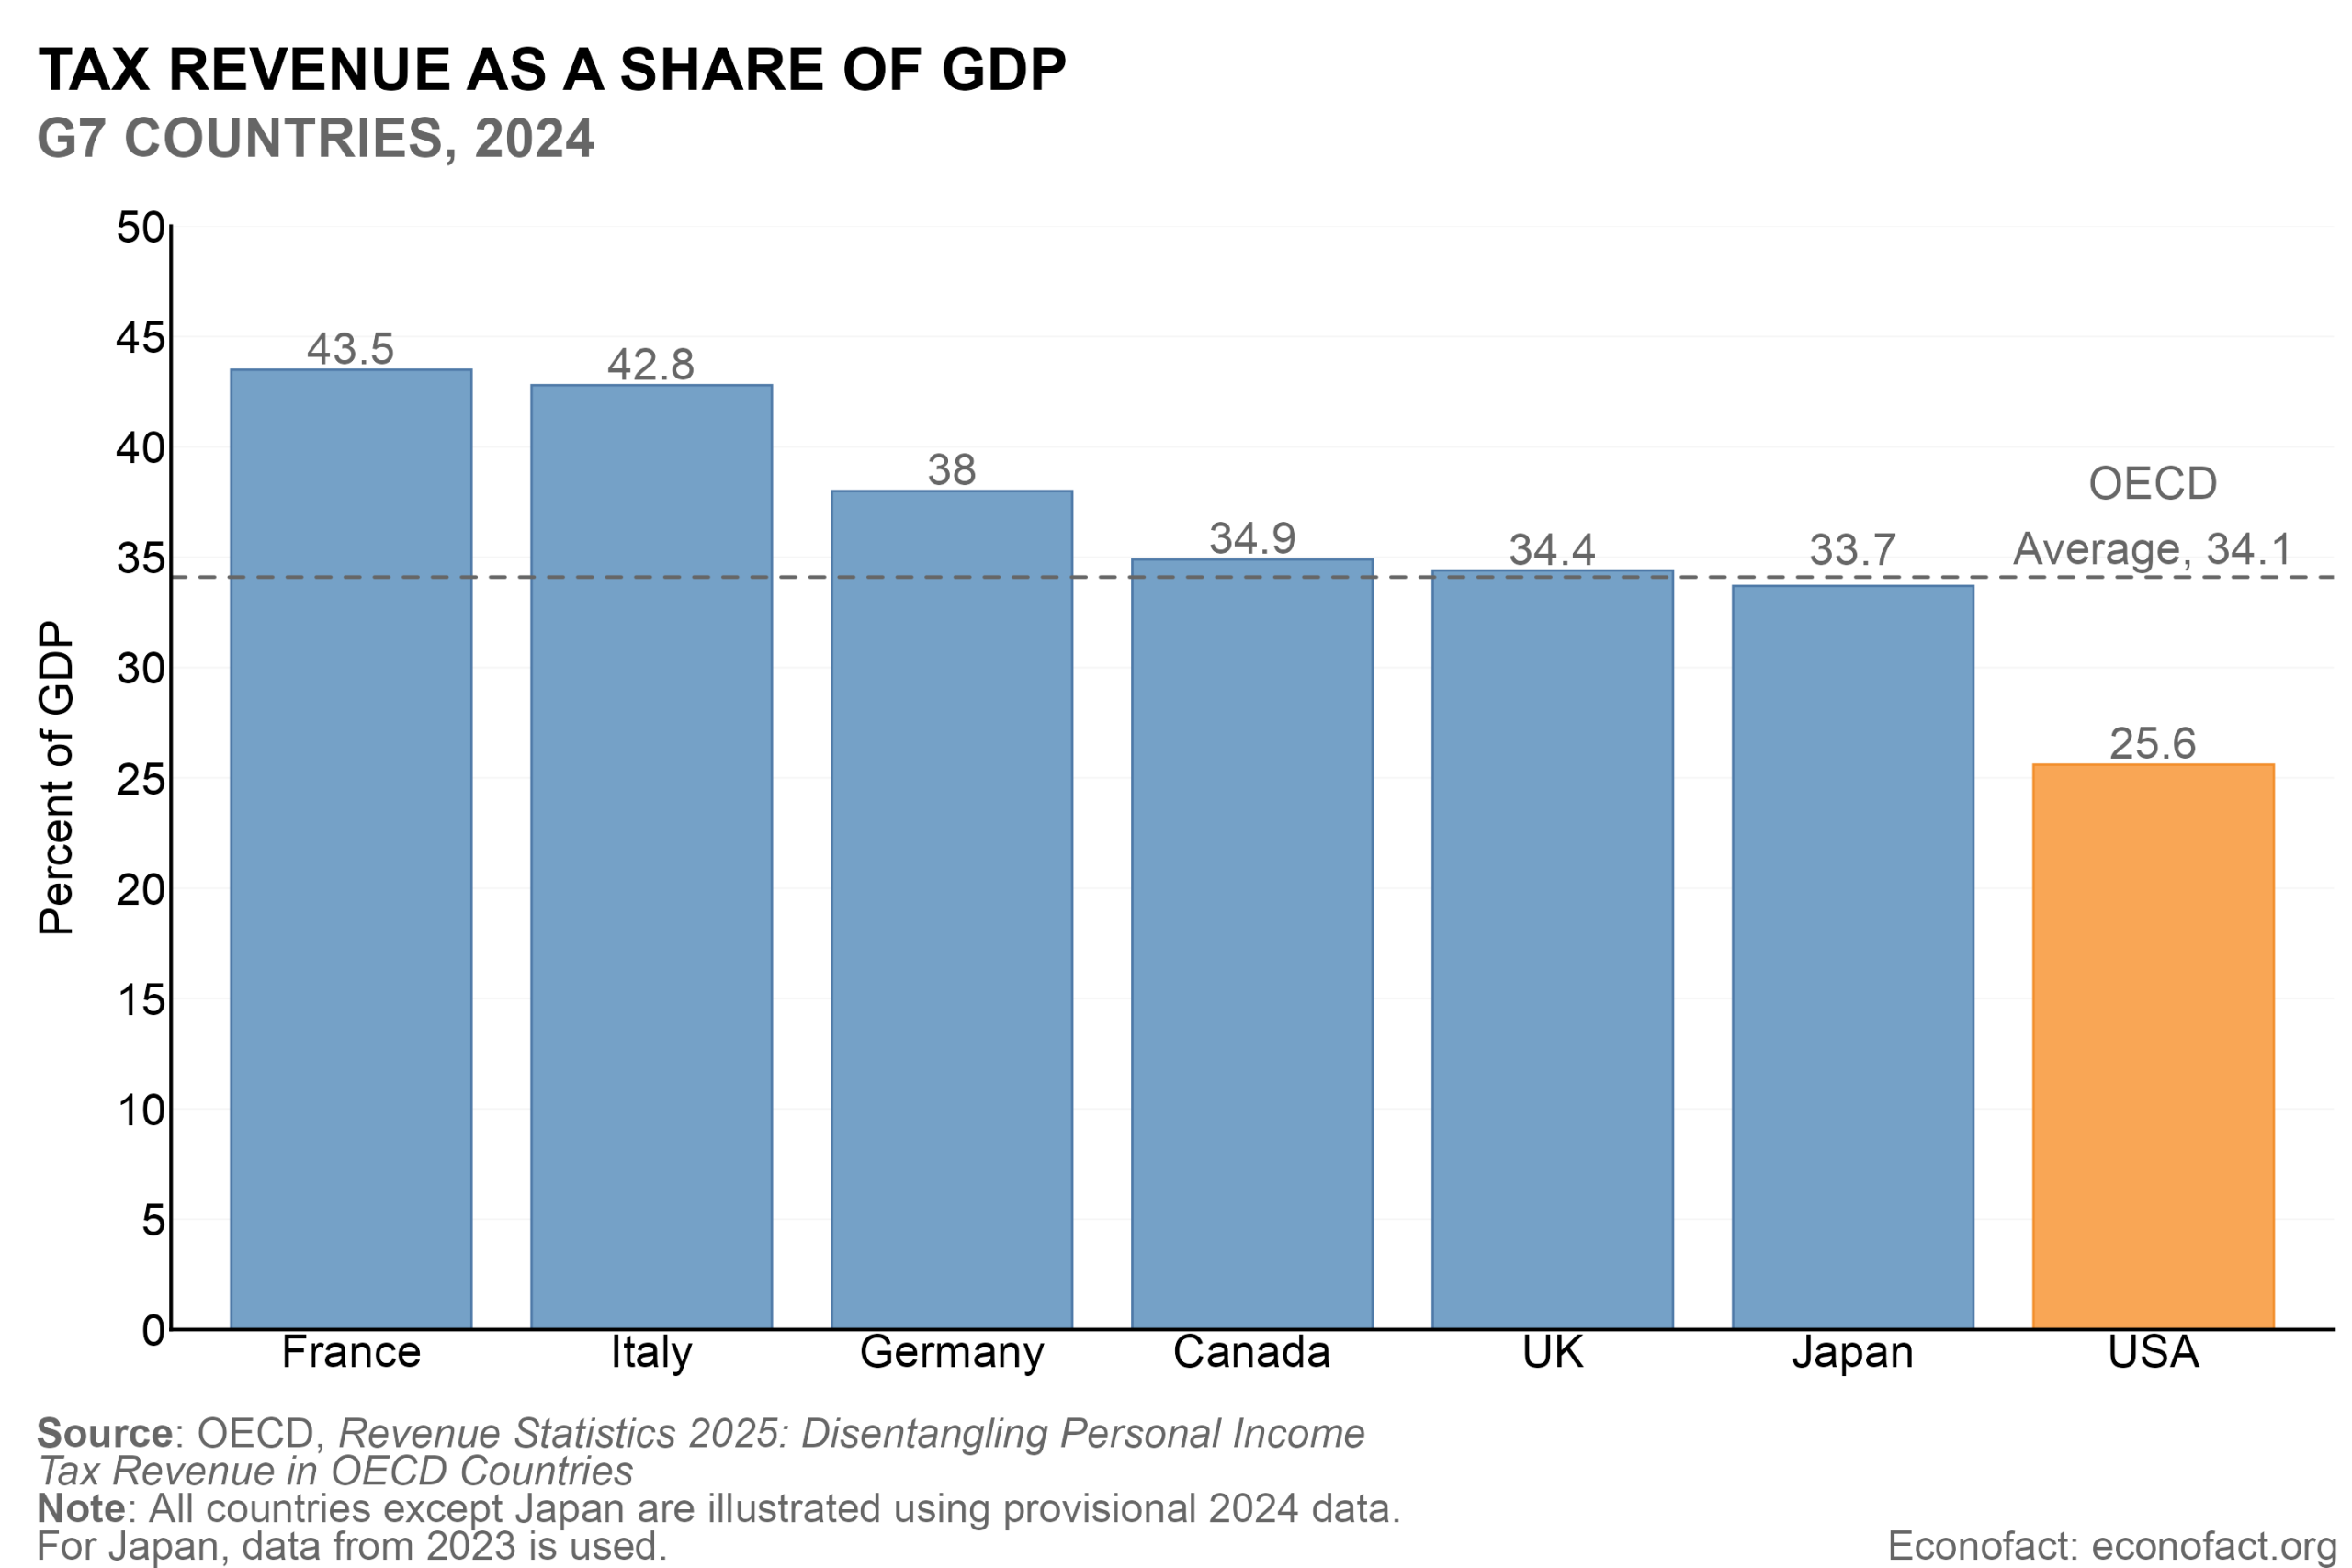
- Despite popular perceptions to the contrary, U.S. taxes are very low compared to other OECD countries. In 2024, general government (federal plus state and local government) tax revenues in the United States totaled only about 25½ percent of GDP, almost 10 percentage points lower than the OECD average (see here). This gap largely owes to the absence in the United States of broad-based value added or sales taxes — U.S. taxes on goods and services totaled only 4¼ percent of GDP in 2023 compared with an OECD average of 10½ percent of GDP. Social security taxes and corporate income tax revenues are also below the OECD average, while revenues from personal income taxes and property taxes are above the OECD average.
- The U.S. personal income tax system is progressive, since tax rates at both the federal and state levels rise with income. However, while the combined rate can exceed 50 percent in some high-tax states like California, the degree of progressivity—including relative to other OECD countries—depends on the type of taxpayer. This can be illustrated using the OECD’s measure of the combined tax rate on labor income (termed the “tax wedge”), which includes income taxes, social security contributions, and regular cash benefits. This measure shows that the average rate paid by a single person in the United States rises from 26¼ percent for those earning half the average wage to 36¾ percent for someone earning 250 percent of the average wage, whereas the average rises from 27 percent to 41¾ percent in the average OECD country, respectively. However, these same data show that the U.S. tax system is much more progressive than most other OECD countries for families with children when account is made of the significant child and similar tax credits that are available to low-income households with children (see also the CBO’s analysis here).
- There remains considerable debate about the degree to which the U.S. tax system should be seen as progressive, especially when accounting for nonwage income. It is often argued that simply focusing on labor income tax rates overstates progressivity since very wealthy households earn a large proportion of income from nonwage sources — such as capital gains, dividends, etc. — that bear a much lower tax rate. Indeed, one recent study estimated that after accounting for income from other sources the effective tax rate was only around 24 percent for those in the list of the Forbes 400 richest people in America, compared to 45 percent for the top labor income earners. Analysis like this led to an unsuccessful legislative proposal in 2012 to impose a flat 30 percent tax (the so-called “Buffett Rule”) on all types of income that would be phased in for those earning over $1 million. Conversely, some have cautioned that the U.S. system’s progressivity has increased over time — even after taking into account nonwage income — because of the expansion of transfer programs for lower income households and a curbing of tax shelters for the wealthy, among other factors. Similarly, there are those who argue that progressivity — including relative to other countries — is higher when account is taken of: lifetime tax burdens, charitable giving, and bequests (see here and here); the fact that the U.S. system has had higher corporate and capital gains taxes than other OECD countries, which tend to disadvantage the wealthy; and the fact that U.S. households pay relatively little in the way of sales taxes, which tend to disadvantage lower income households (e.g., here). Others have noted that an assessment of U.S. progressivity should take account of relatively low levels of government spending on education, health, and other social services, which means that the overall tax and transfer system does less to support the poor than in the vast majority of OECD countries (see here).
- There is a greater consensus that the U.S. income tax system is complex compared to other countries and imposes a significant compliance burden. The system’s complexity results from numerous factors: a relatively large number of tax brackets, different tax rates for wage and nonwage income, and a vast number of special tax breaks for both businesses and households. Despite attempts to simplify the federal tax system (e.g., the 2017 Tax Cuts and Jobs Act), compliance costs borne by households and businesses are still estimated to be as high as 1.8 percent of GDP. International comparisons of these costs are difficult but one study ranked the U.S. personal and business tax system poorly against four other industrial countries in terms of “ease of payment” and even worse in terms of “hours to comply.” Another study’s index of the corporate tax system’s complexity places the U.S. system broadly in the middle of the OECD countries. The complexity of the U.S. system likely undermines collection rates — the IRS estimates that roughly 13 percent of tax obligations are unpaid, which largely reflects misreporting of business income on individual tax returns (see here, here and here). And this tax gap has increased during the past decade in the context of cutbacks in the IRS’s funding, its workforce, and its rate of examinations (see here and here).
- There is also broad agreement among economists that more could be done to improve the U.S. tax system’s support for growth. The relatively low level of U.S. taxes is often argued to have improved the dynamism of the U.S. economy by increasing the returns to business and other economic activities. However, many have suggested that low taxes have led to higher fiscal deficits that have dampened investment by pushing up interest rates, and that low levels of government revenue have also made it difficult to fund growth-enhancing social and infrastructure programs (see here). It is also generally agreed that the structure of the U.S. system — with its relatively high reliance on income- versus consumption-based taxes — tends to disincentivize both labor employment and capital investment (see discussion here). And in a cross-country comparison, the U.S. system is ranked only 15th in terms of tax competitiveness compared with other OECD countries, based on an index that considers a range of factors including a system’s ability to raise revenues with low marginal rates, its complexity, its tilt toward consumption versus income taxes, and its avoidance of special tax breaks (see here). Several studies have illustrated that revenue-neutral reforms aimed at simplifying the existing U.S. tax system and broadening its base could boost the economy (for a discussion, see here and here).
What this Means:
Despite a long history of legislative efforts to reform the U.S. tax system, there is wide agreement that there is much room for improvement. There also is a clear need to raise U.S. tax revenues considering the very large U.S. fiscal deficit and projections that show that government debt — which is already among the highest in the world as a share of GDP — remains on an upward path. Given the current low level of collections, there is considerable scope to raise revenues without undermining the U.S. position as a low-tax jurisdiction. Moreover, international experience illustrates that reforms — e.g., cutting tax preferences and loopholes, shifting from income- to consumption-based taxes, improving enforcement, and reducing compliance costs — could both help close the fiscal gap and improve the growth-friendliness of the system (examples include here, here, and here). But domestic and international experience also highlights the difficulty of building a broad-based political consensus for such reforms and reassuring taxpayers that the costs and benefits of reform will be shared fairly.
Topics:
Fiscal PolicyLike what you’re reading? Subscribe to EconoFact Premium for exclusive additional content, and invitations to Q&A’s with leading economists.